World map infographic with bright red-orange concentric heat zones highlighting global warming and climate crisis areas. Useful for environmental reports, data visualization, and awareness campaigns. Stock Image
by ViShark
Description
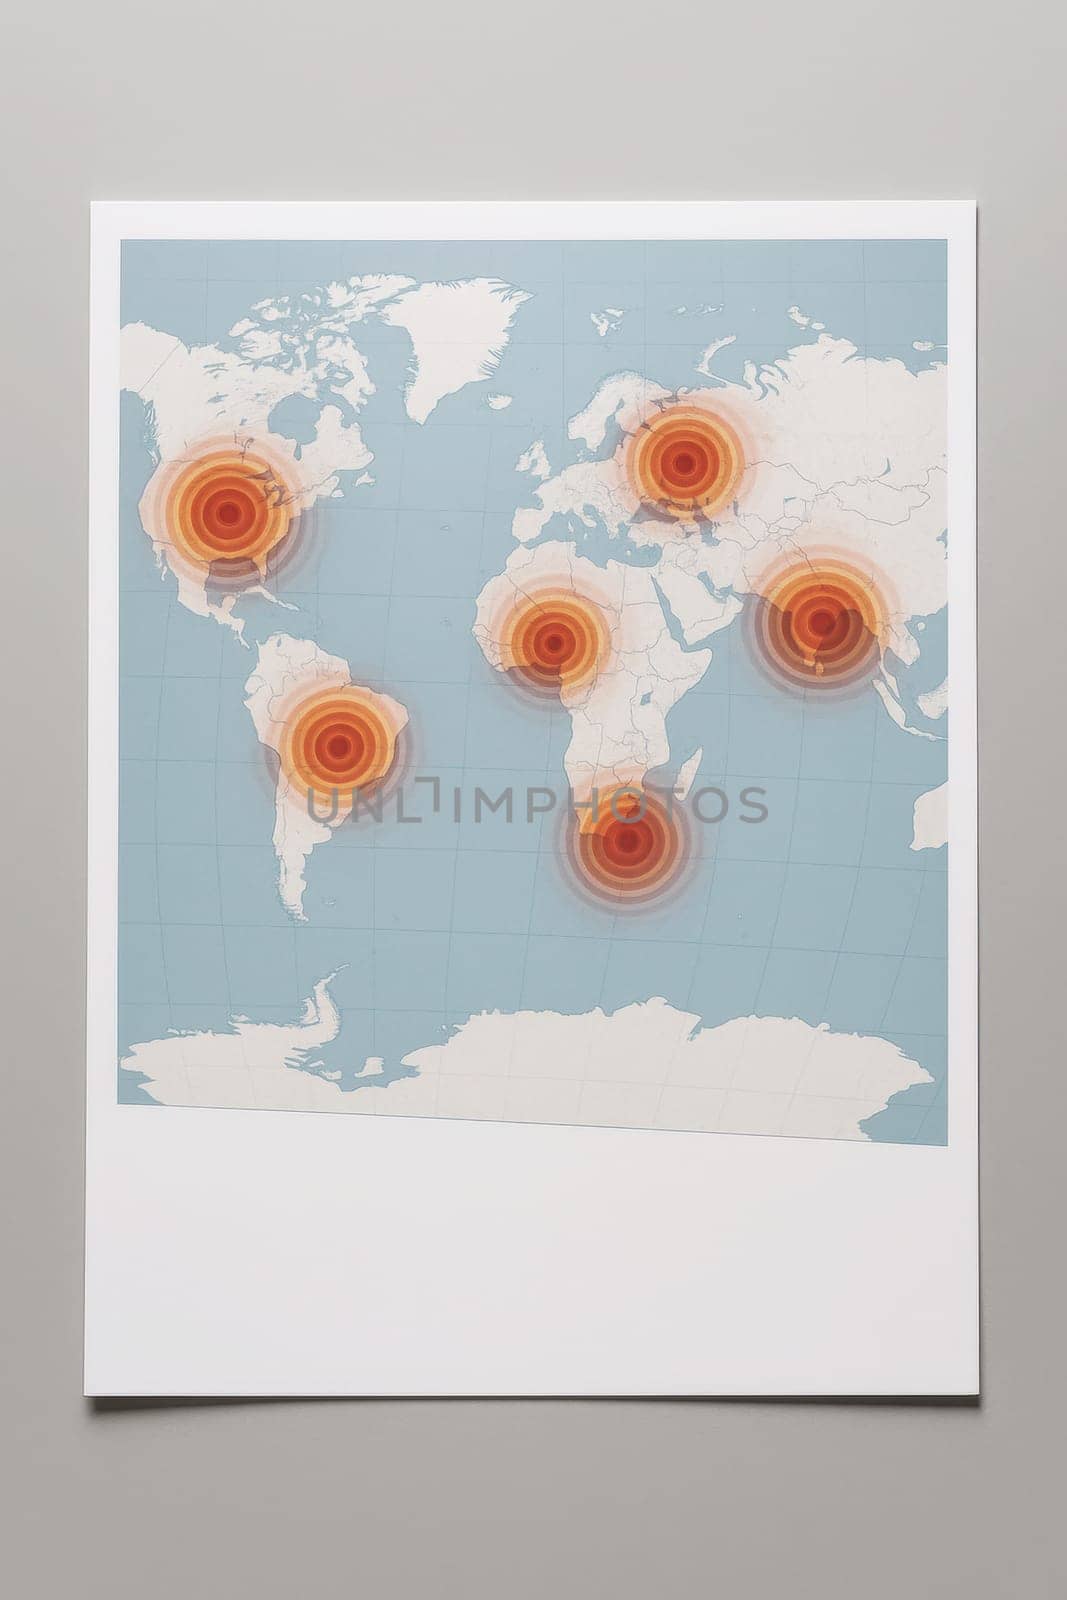
World map infographic with bright red-orange concentric heat zones highlighting global warming and climate crisis areas. Useful for environmental reports, data visualization, and awareness campaigns
Legal
-
Royalty Free License
The license type determines how you can use this image.

Std. Ext. Print / Editorial Graphic Design Web Design Social Media Edit & Modify Multi-user Resale Items 1 Unlimited Runs - Please see licensing information by clicking here
Keywords
- heatmap
- world
- climate
- environment
- infographic
- global
- warming
- data
- impact
- zone
- visual
- crisis
- temperature
- geography
- flat
- design
- ecology
- disaster
- red
- weather
- earth
- atmosphere
- pollution
- alert
- warning
- abstract
- issue
- sustainability
- continents
- illustration
- science
- educational
- energy
- emergency
- top
- view
- mapping
- report
- layout
- modern
- research
- change
- concept
- pattern
- minimal
- danger
- awareness
- political
- cartography
- grid