- Filter By:
-
-
Stock photos and images of technology
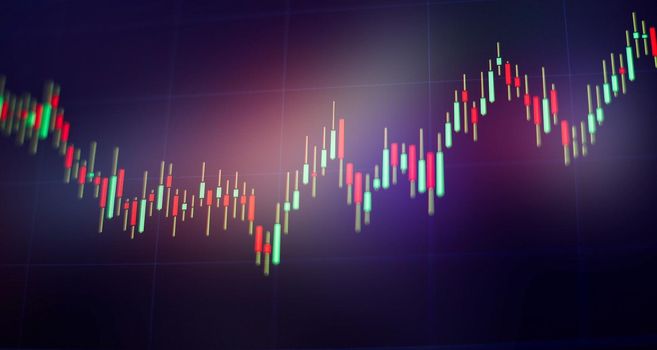
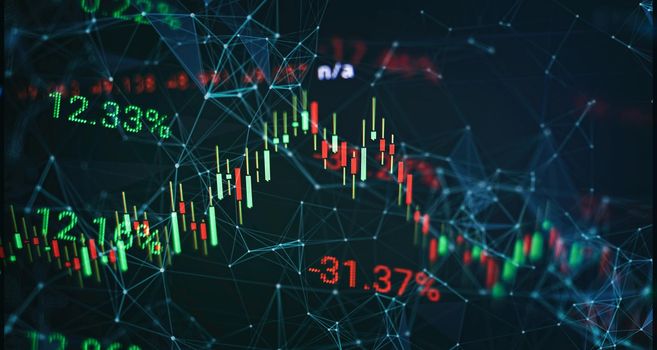
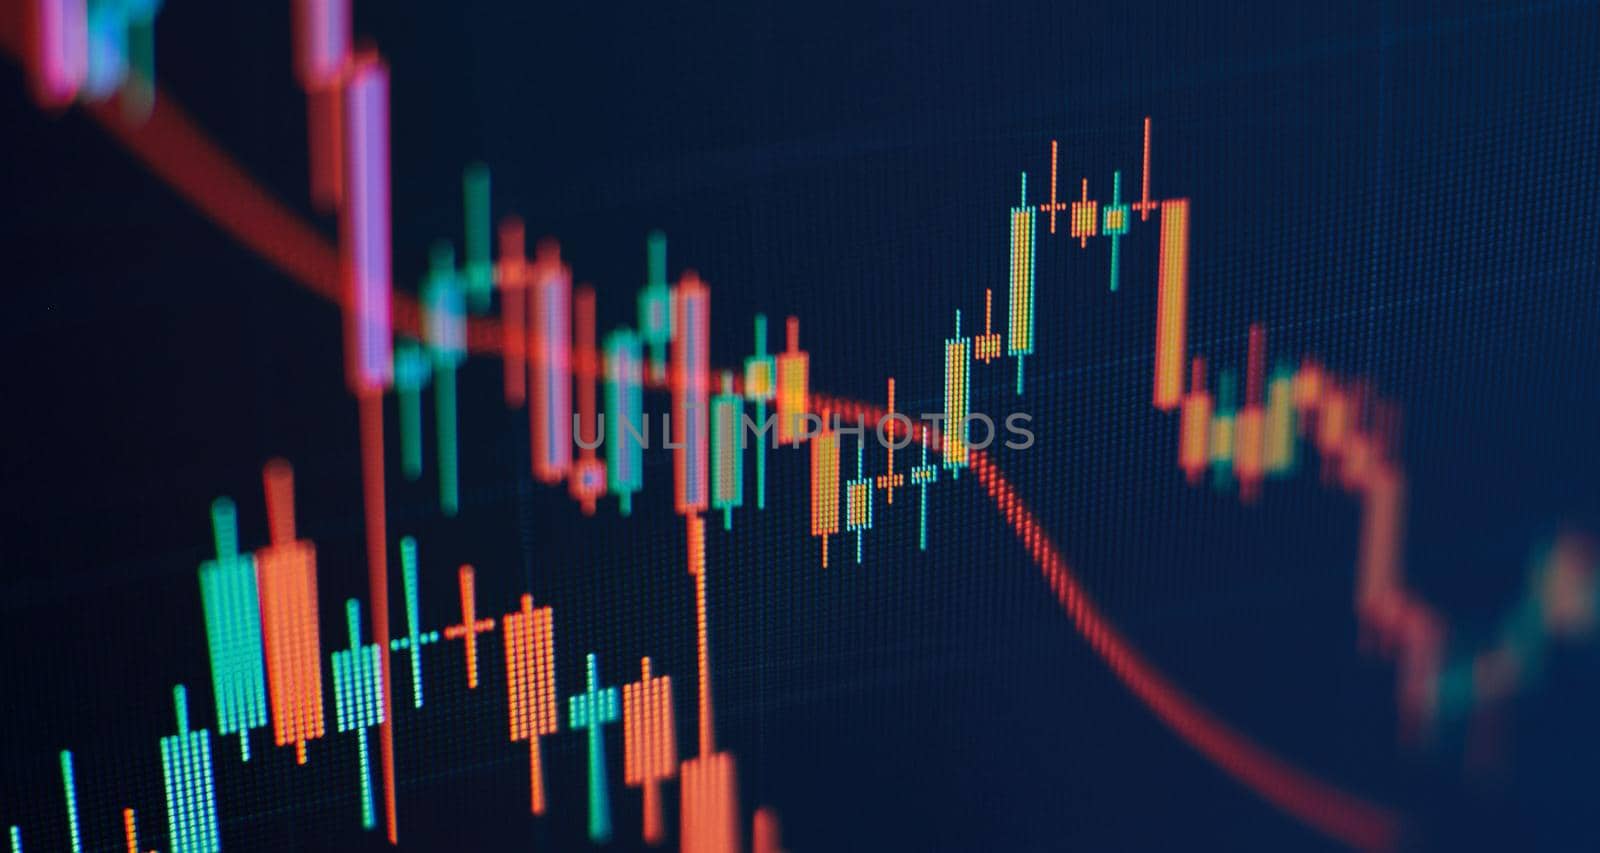
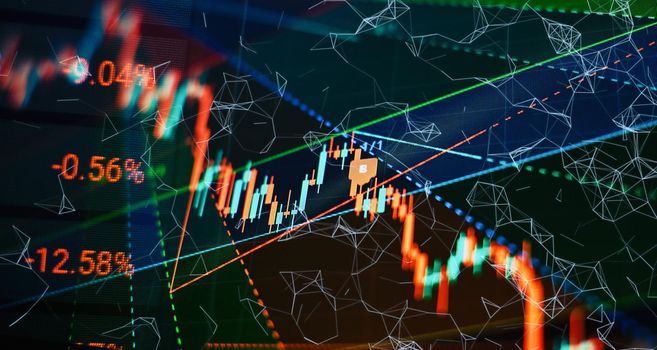
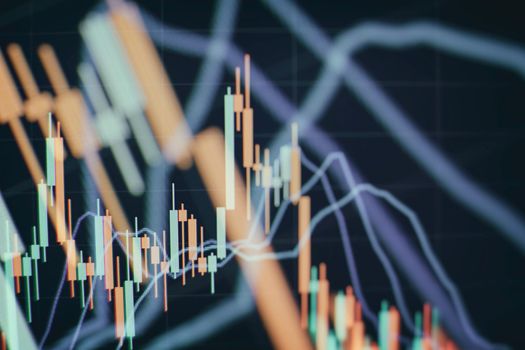
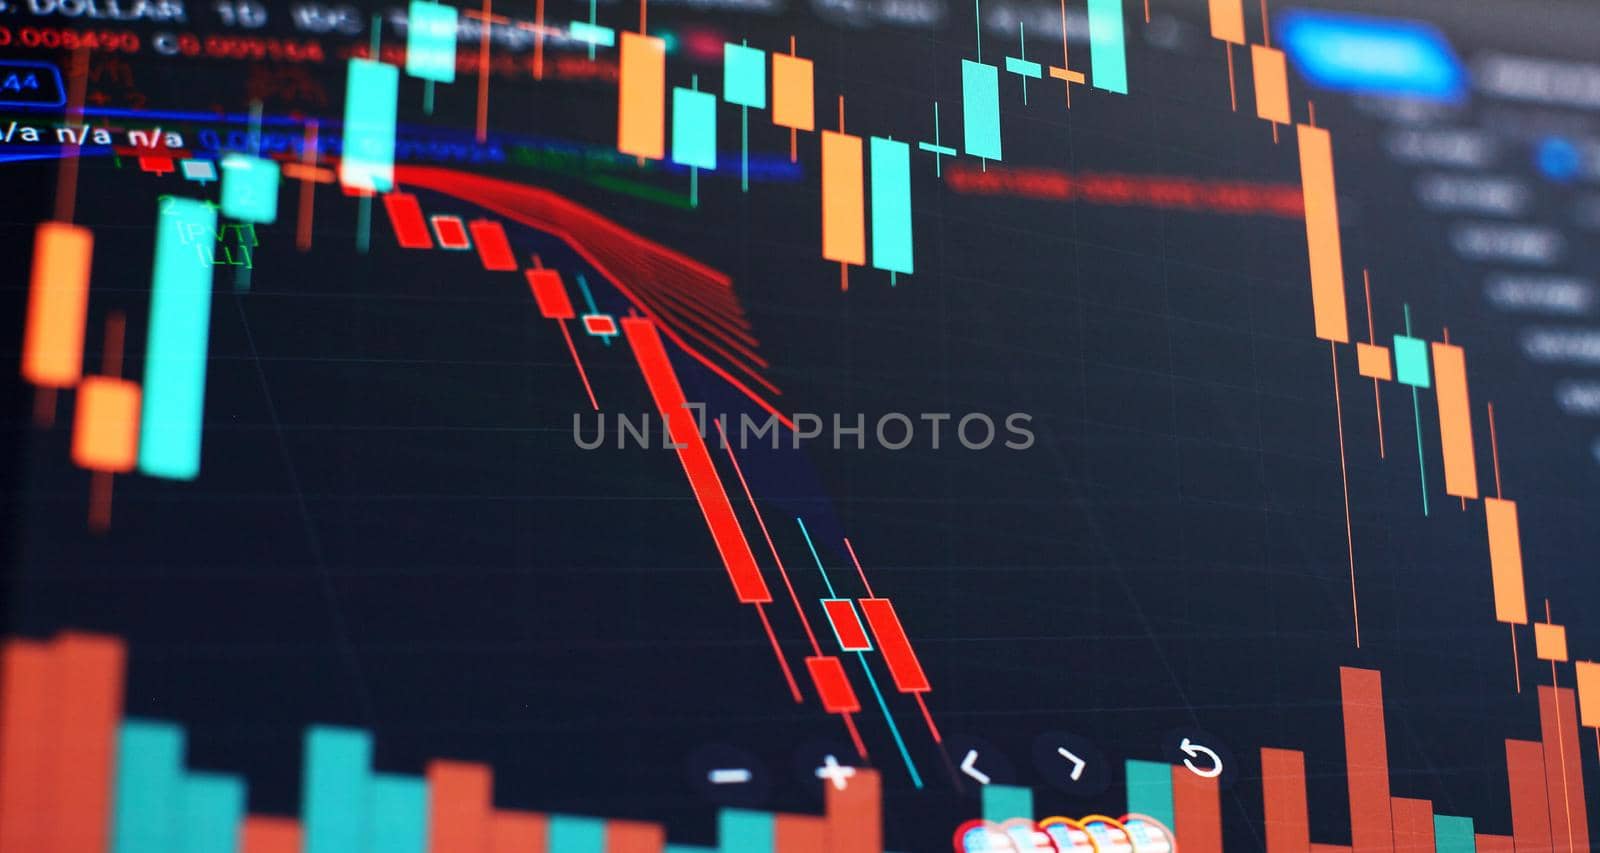
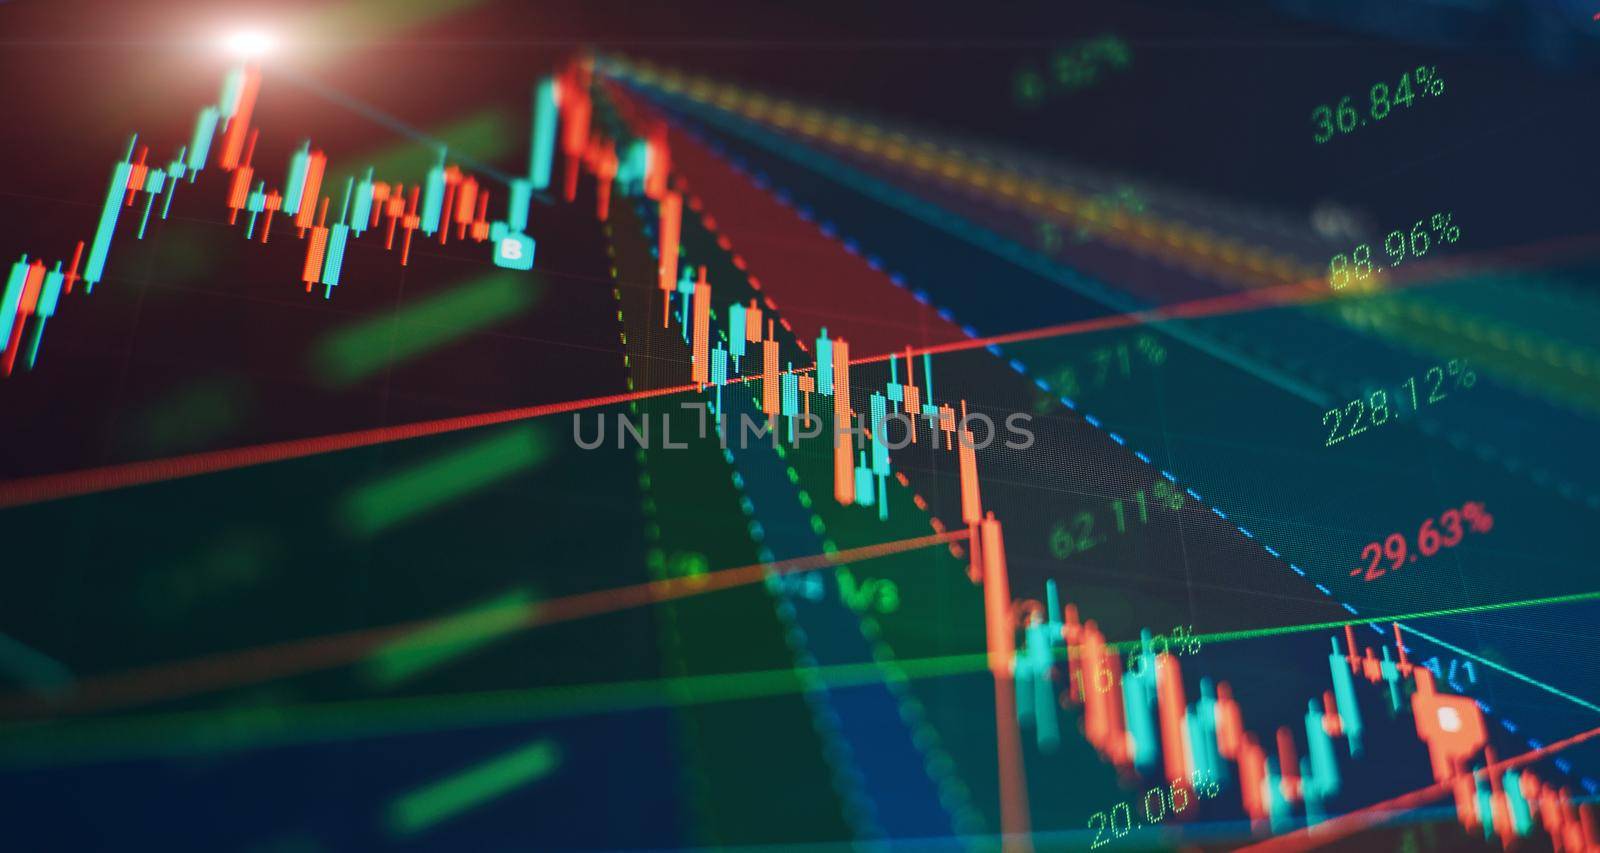
Abstract financial graph with candle stick and bar chart of stock market on financialbackground
Stock PhotoUsername
MaximusndResolution
8858x4724pxAbstract financial graph with candle stick and bar chart of stock market on financialbackground


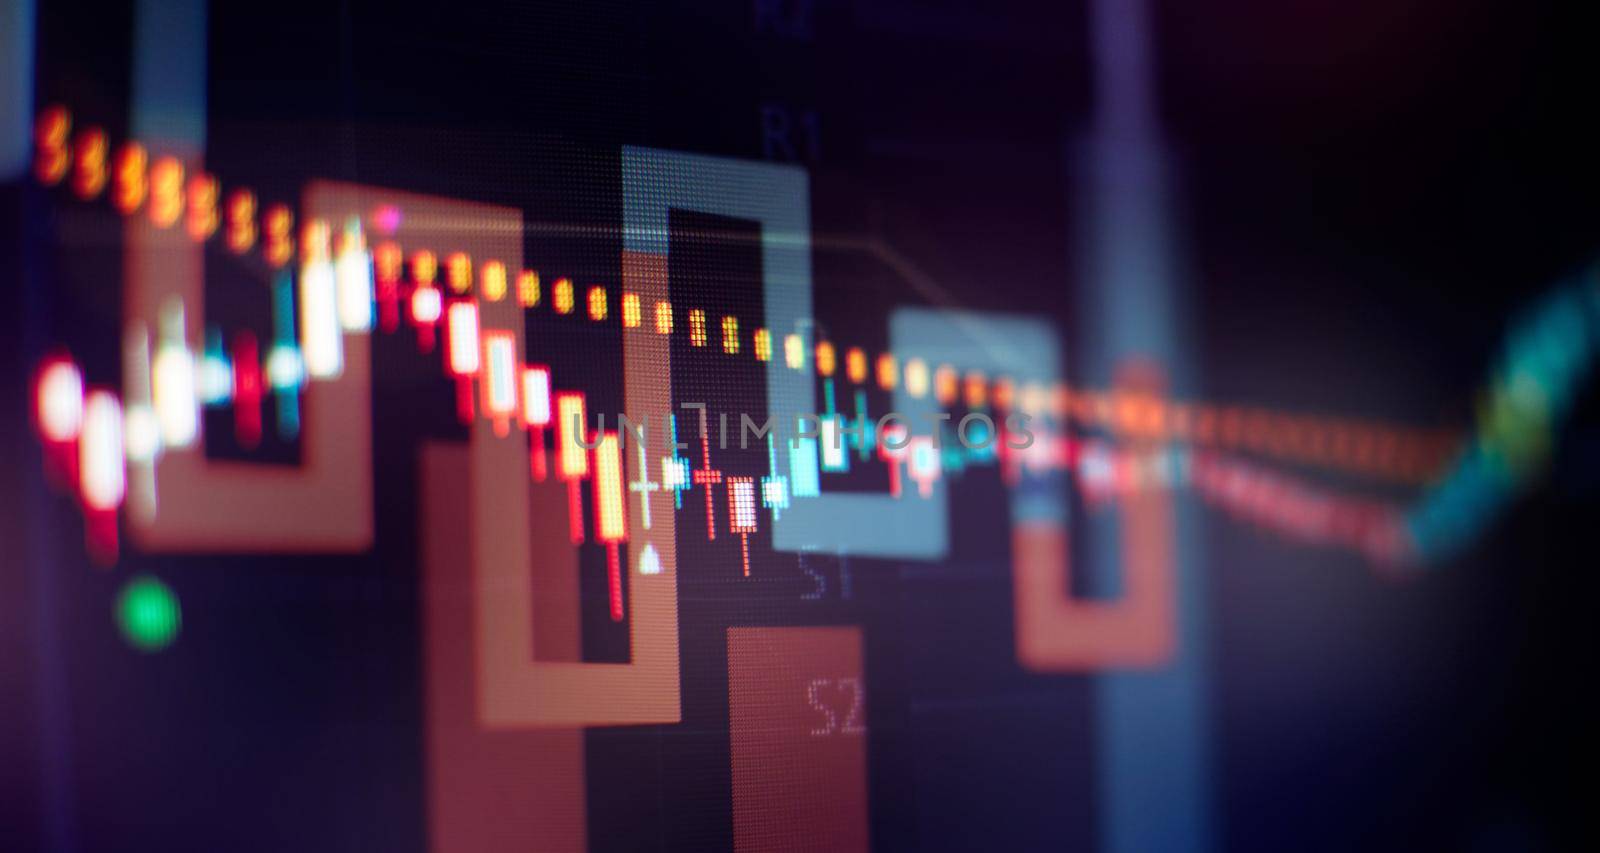
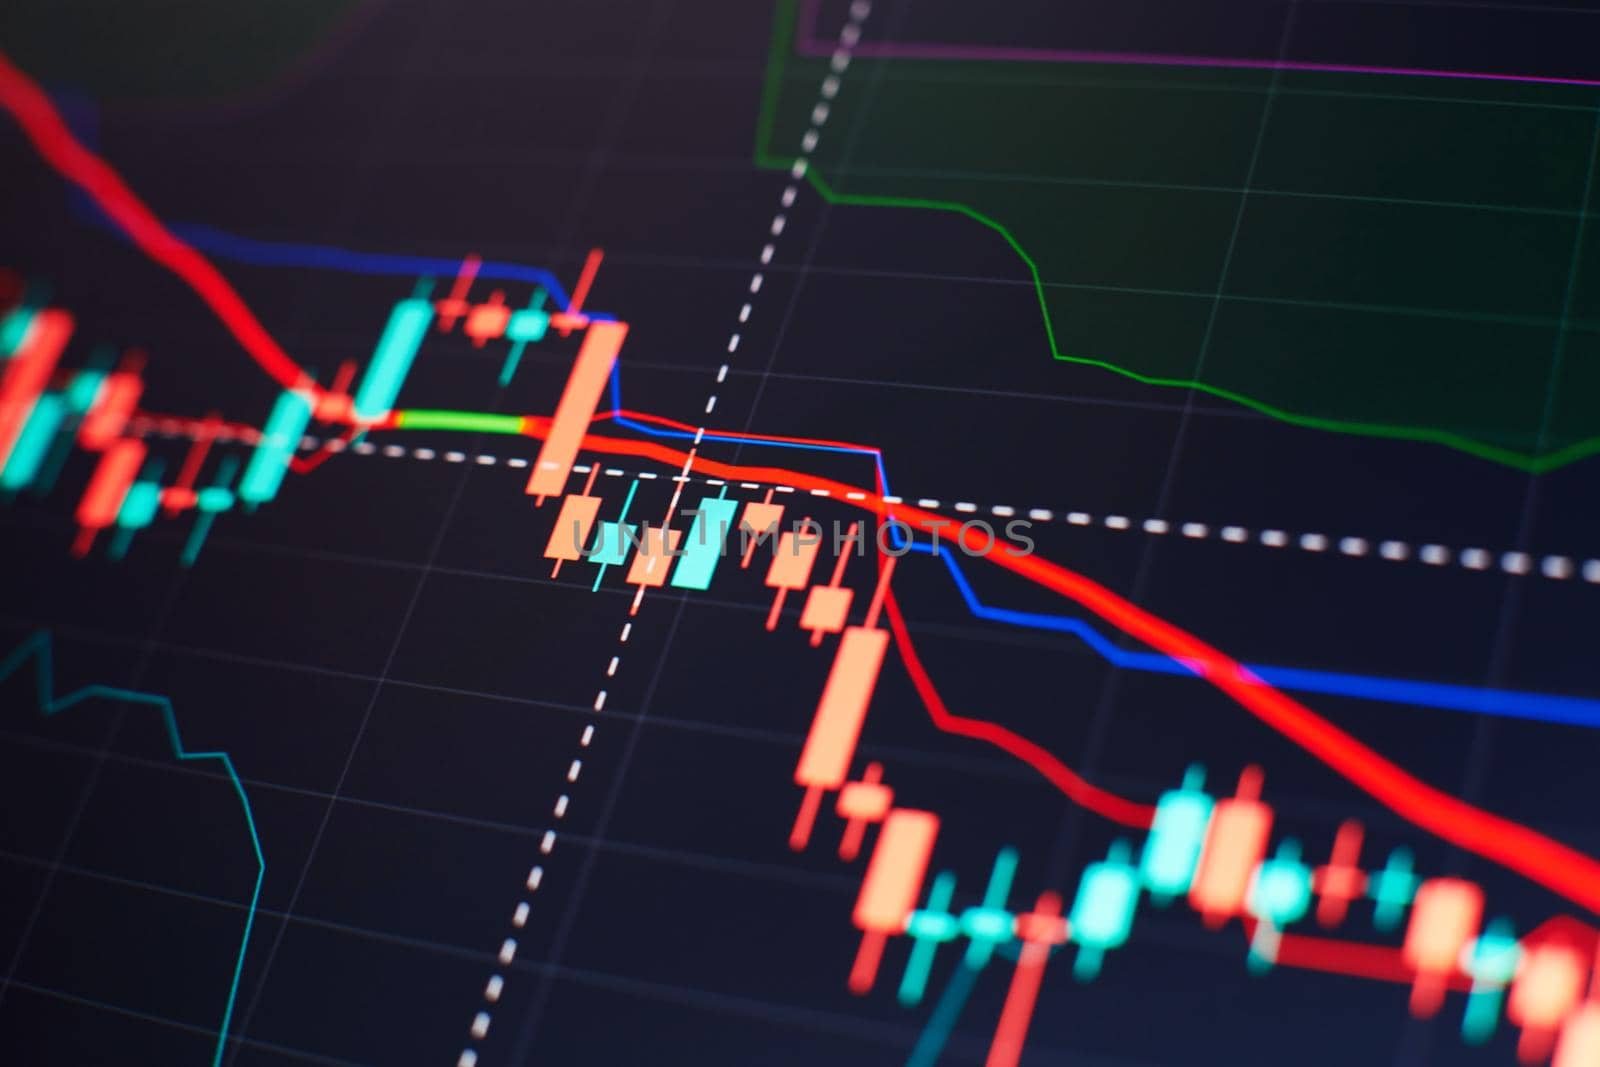
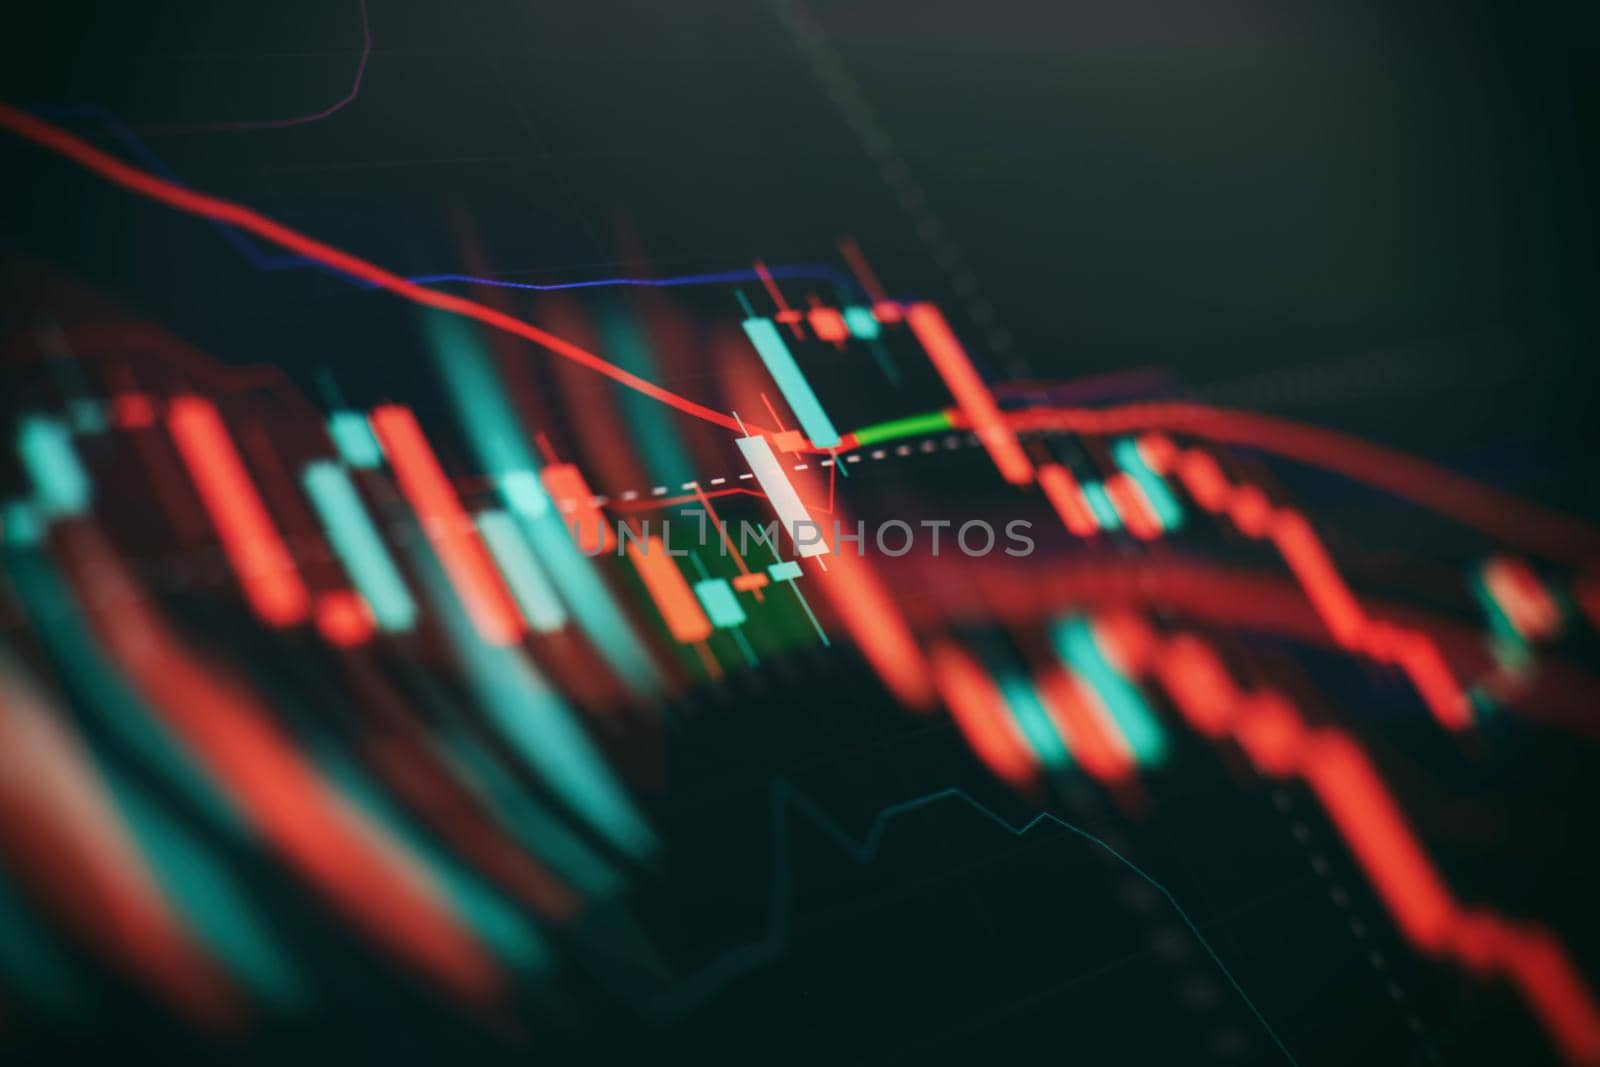
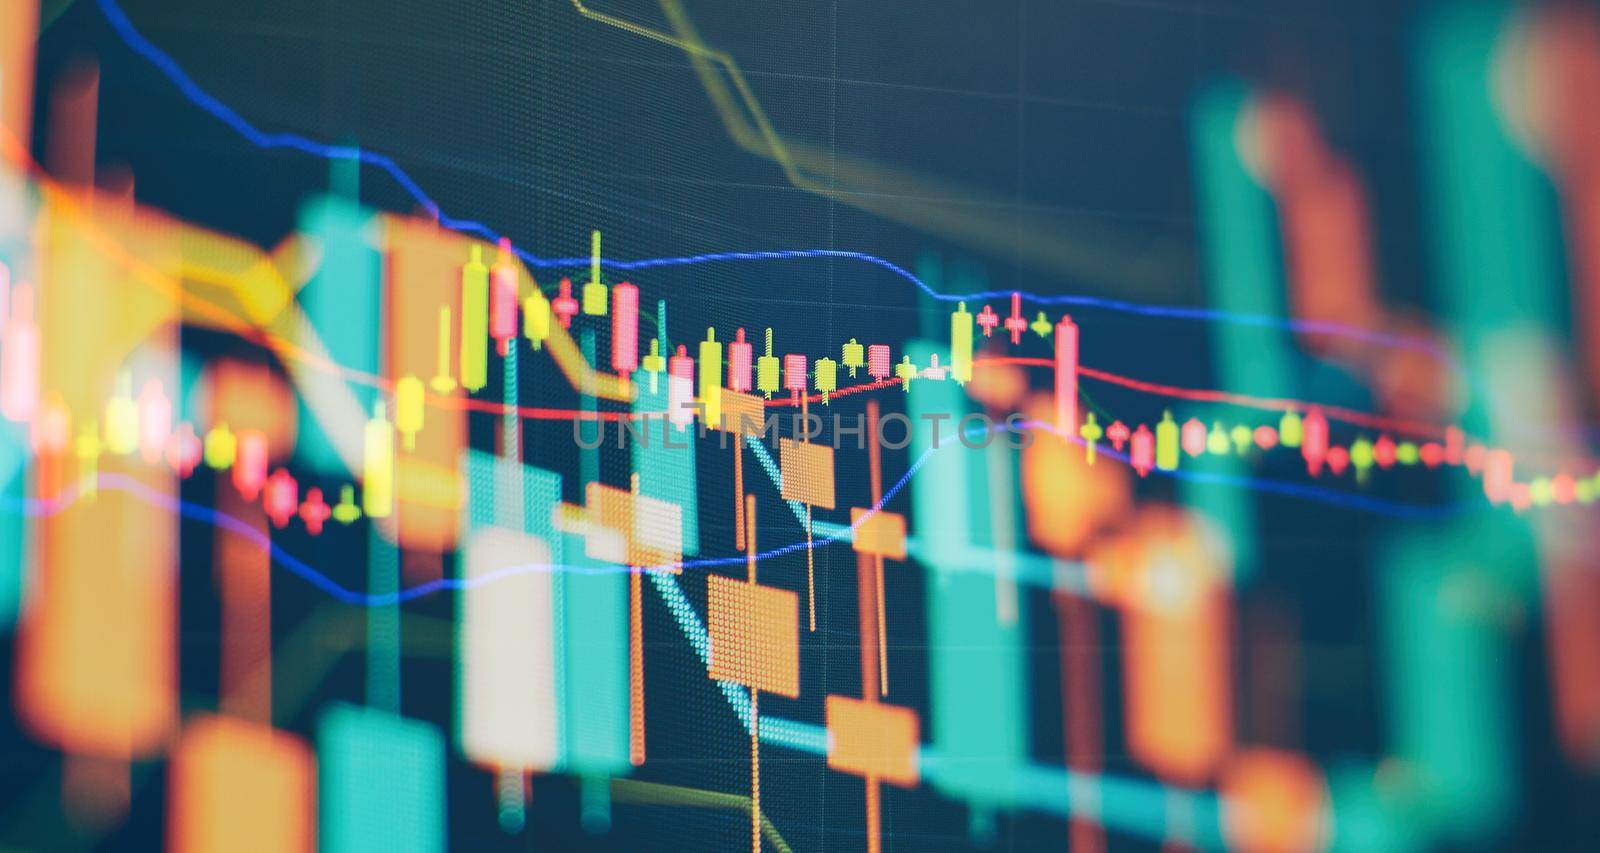
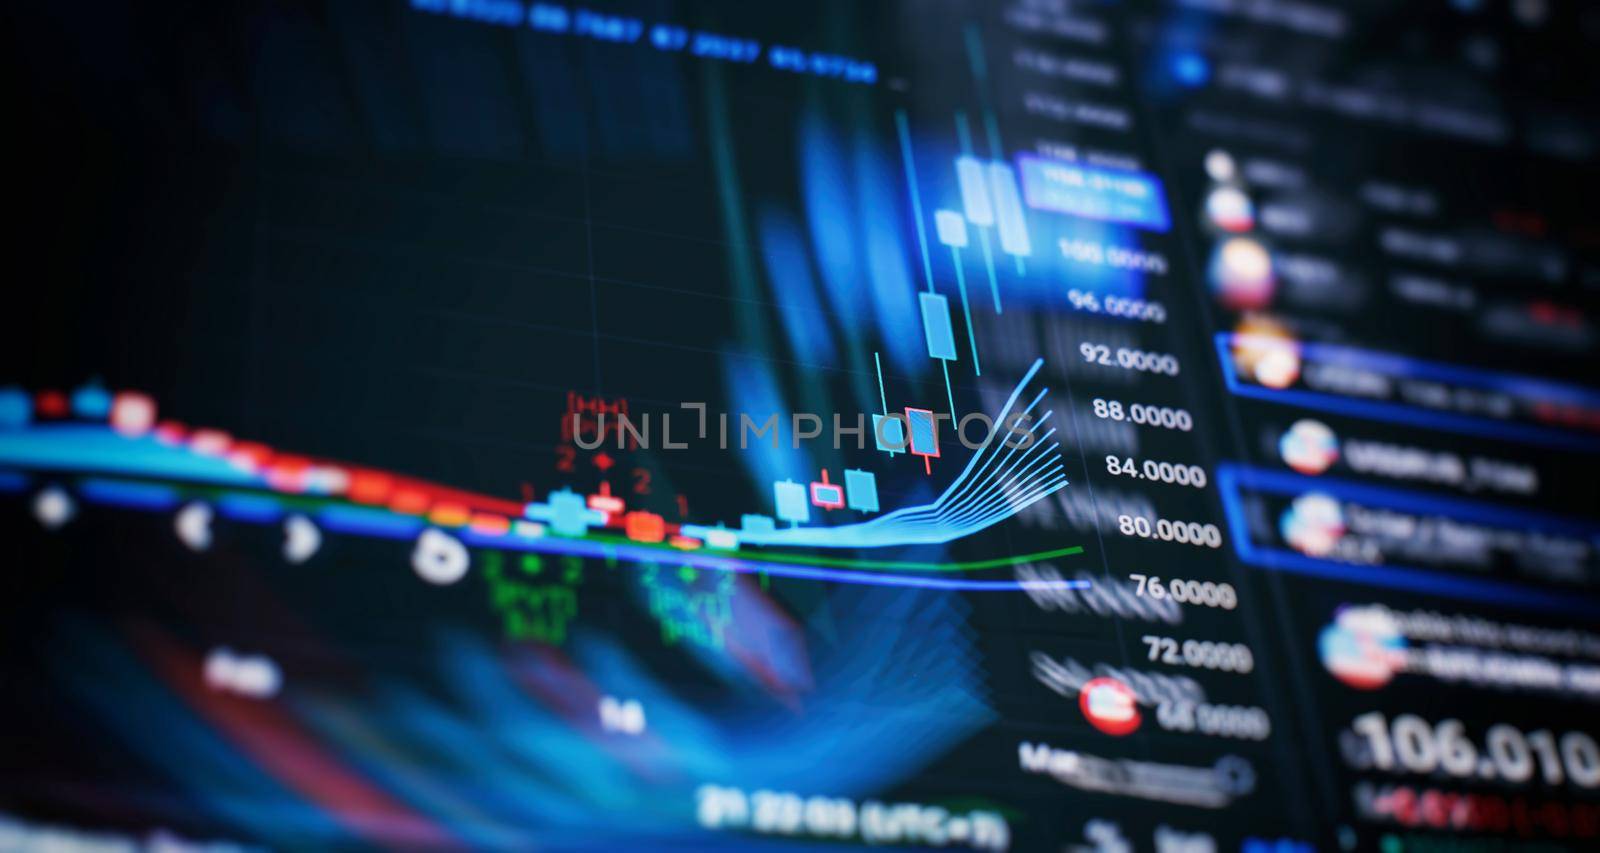
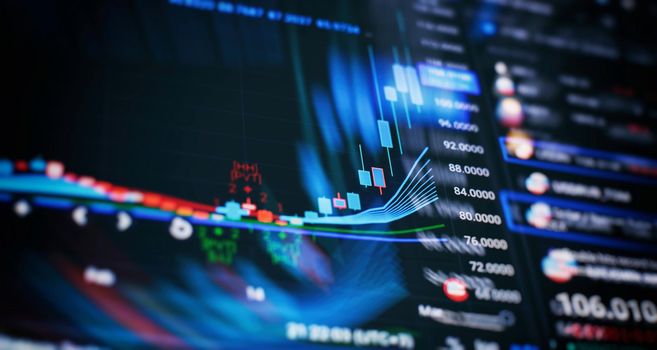
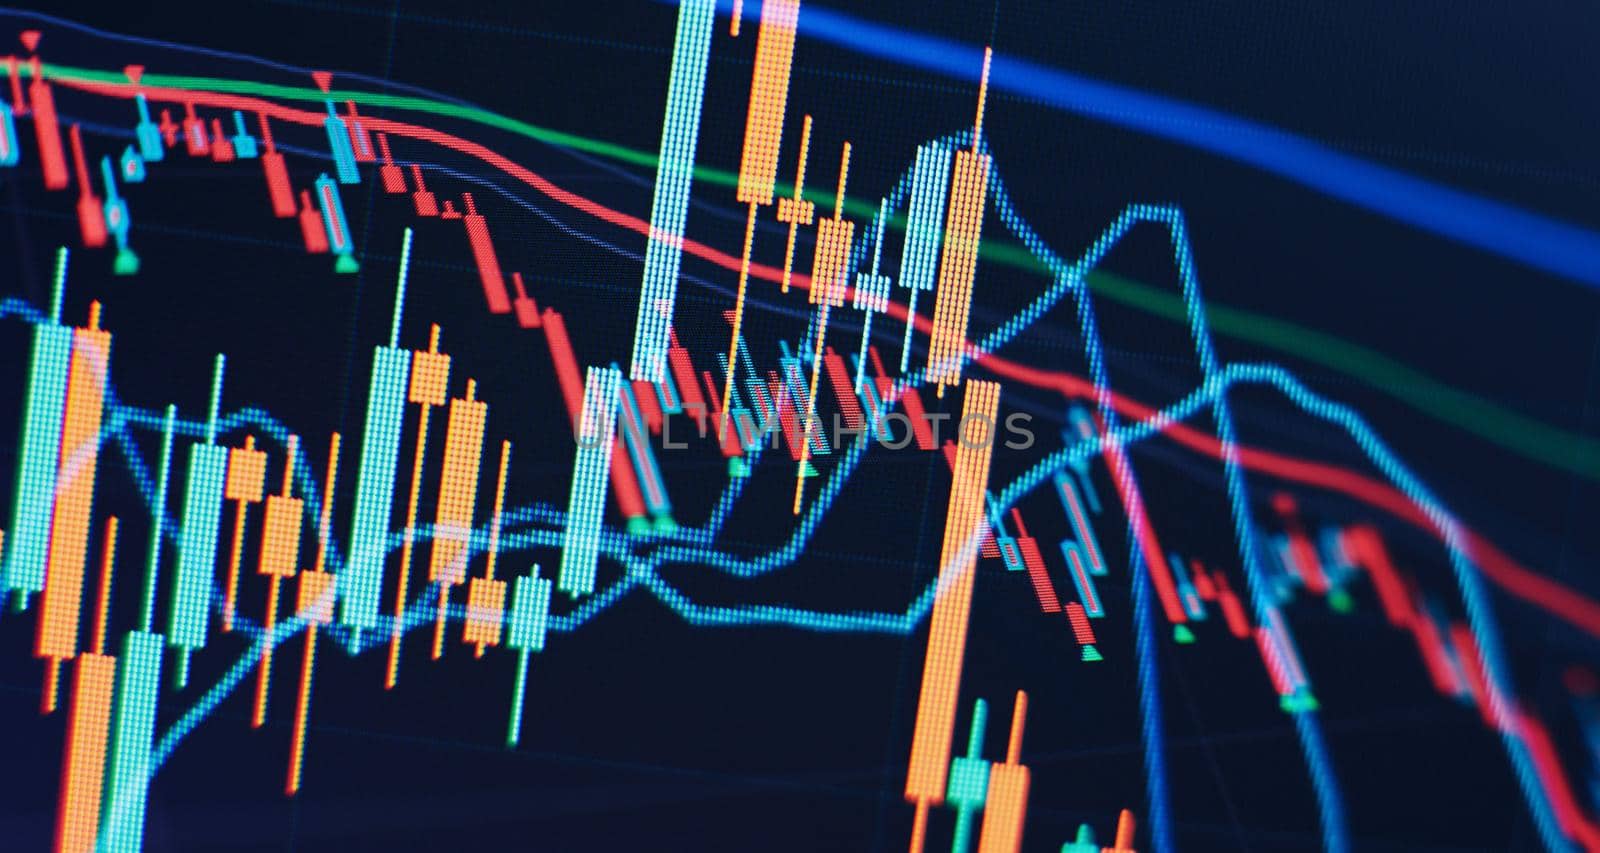
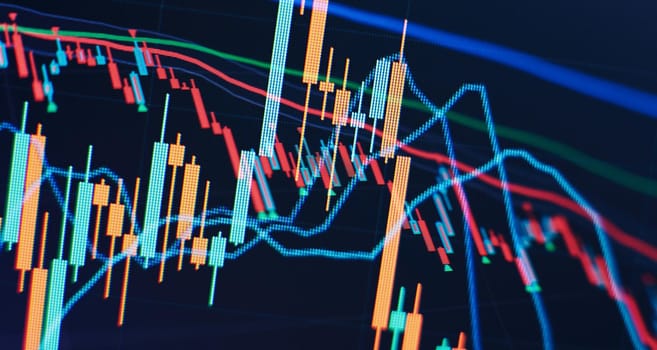
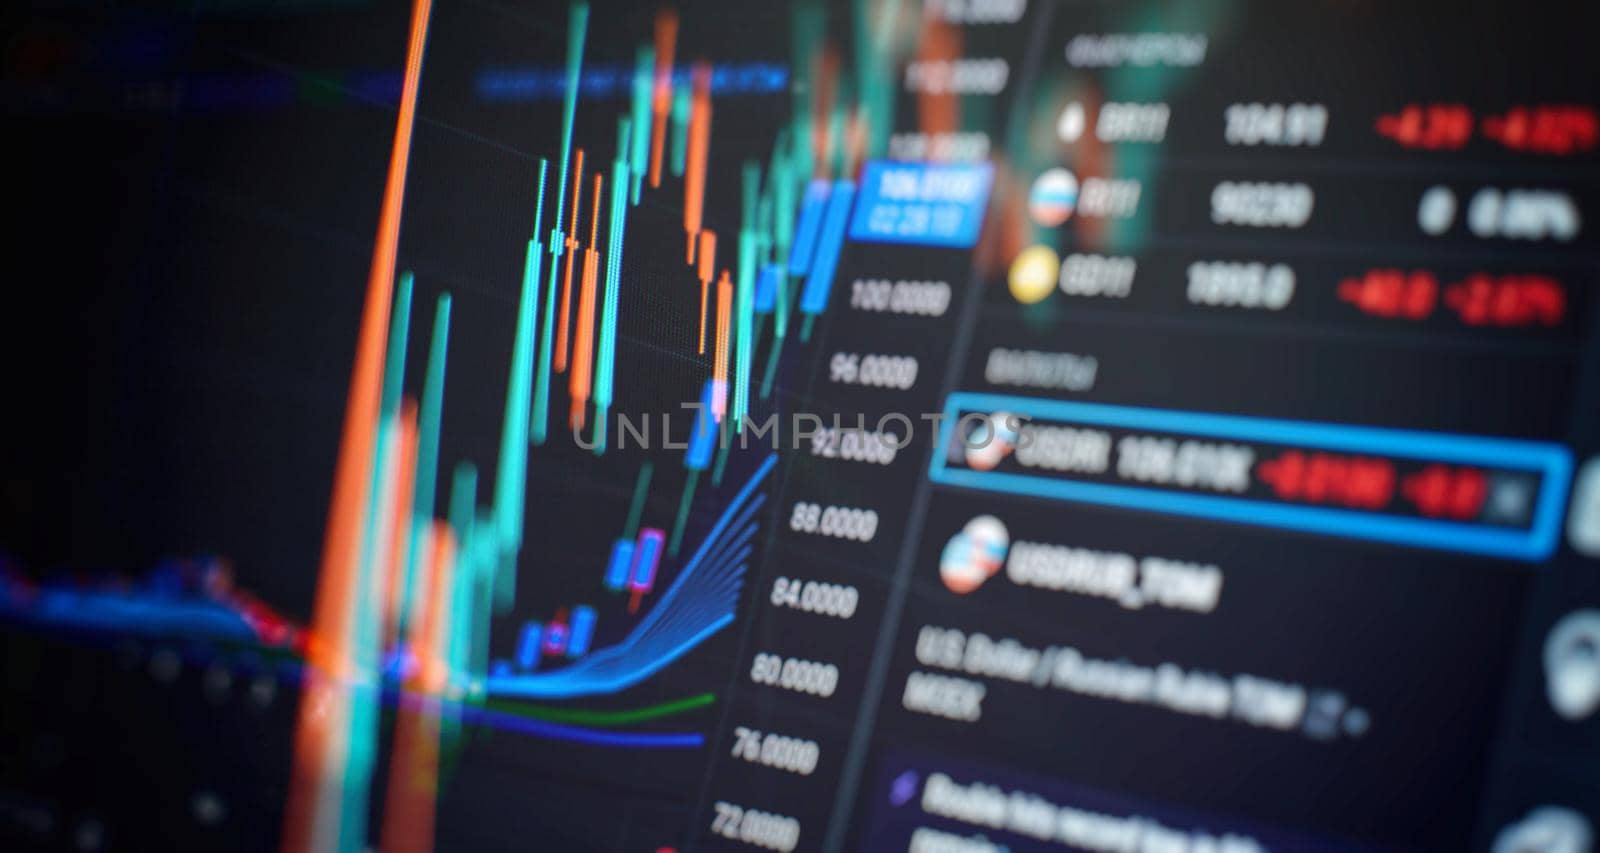
Charts of financial instruments with various type of indicators including volume analysis for professional technical analysis on the monitor of a computer.
Stock PhotoUsername
MaximusndResolution
5472x3648pxCharts of financial instruments with various type of indicators including volume analysis for professional technical analysis on the monitor of a computer.
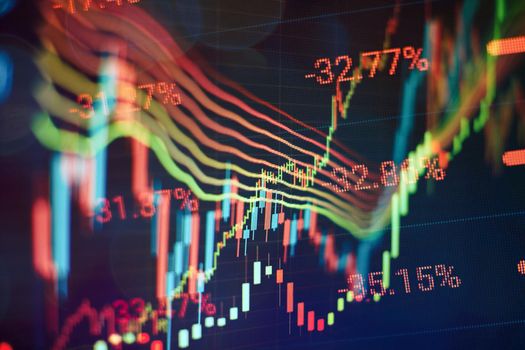
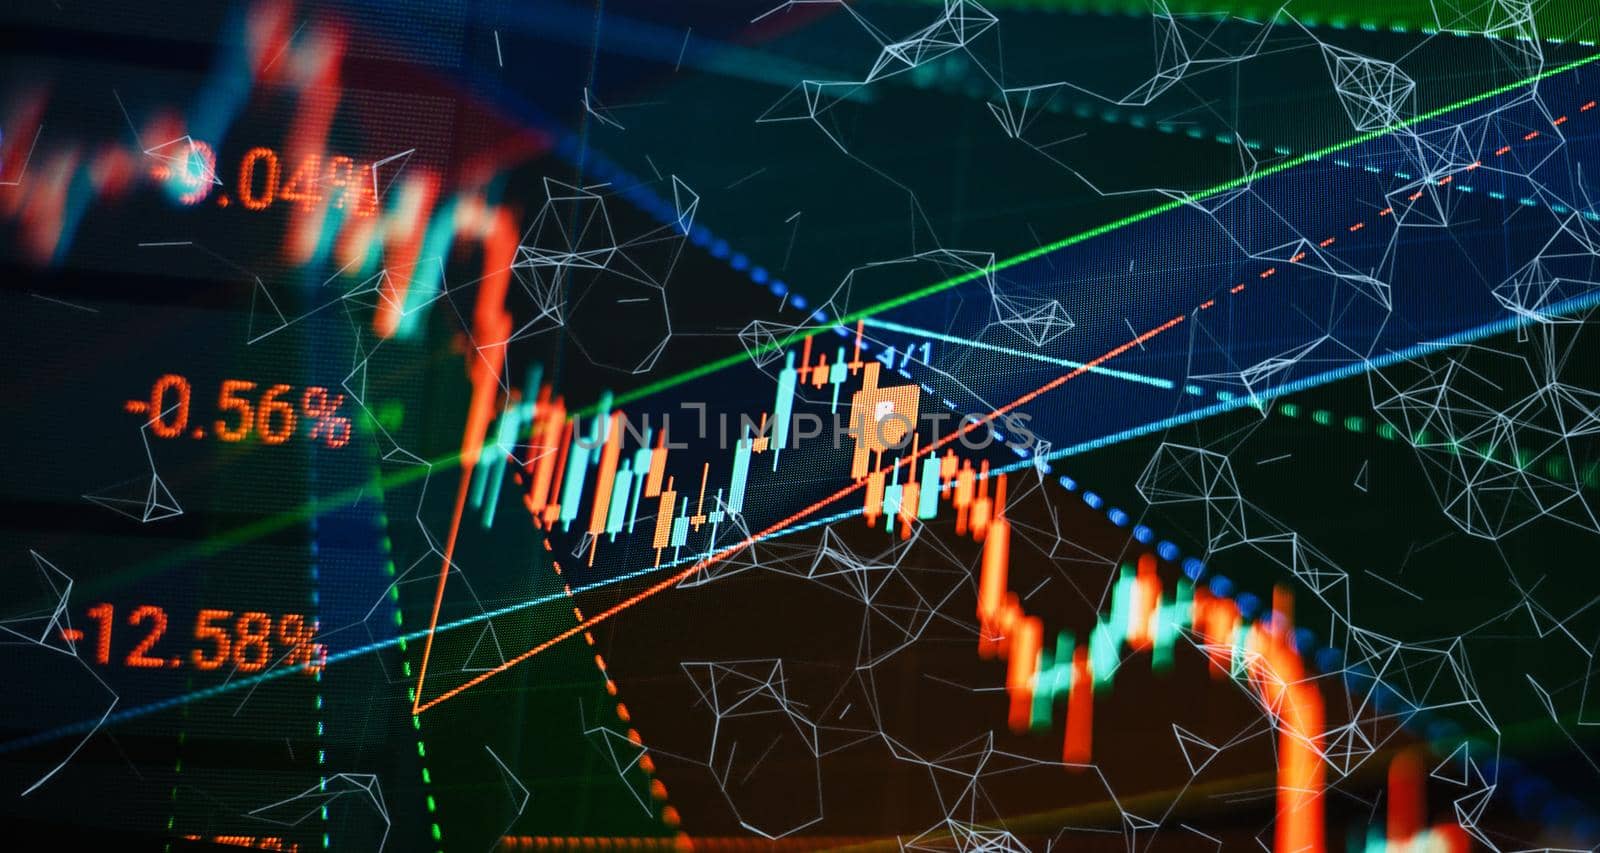
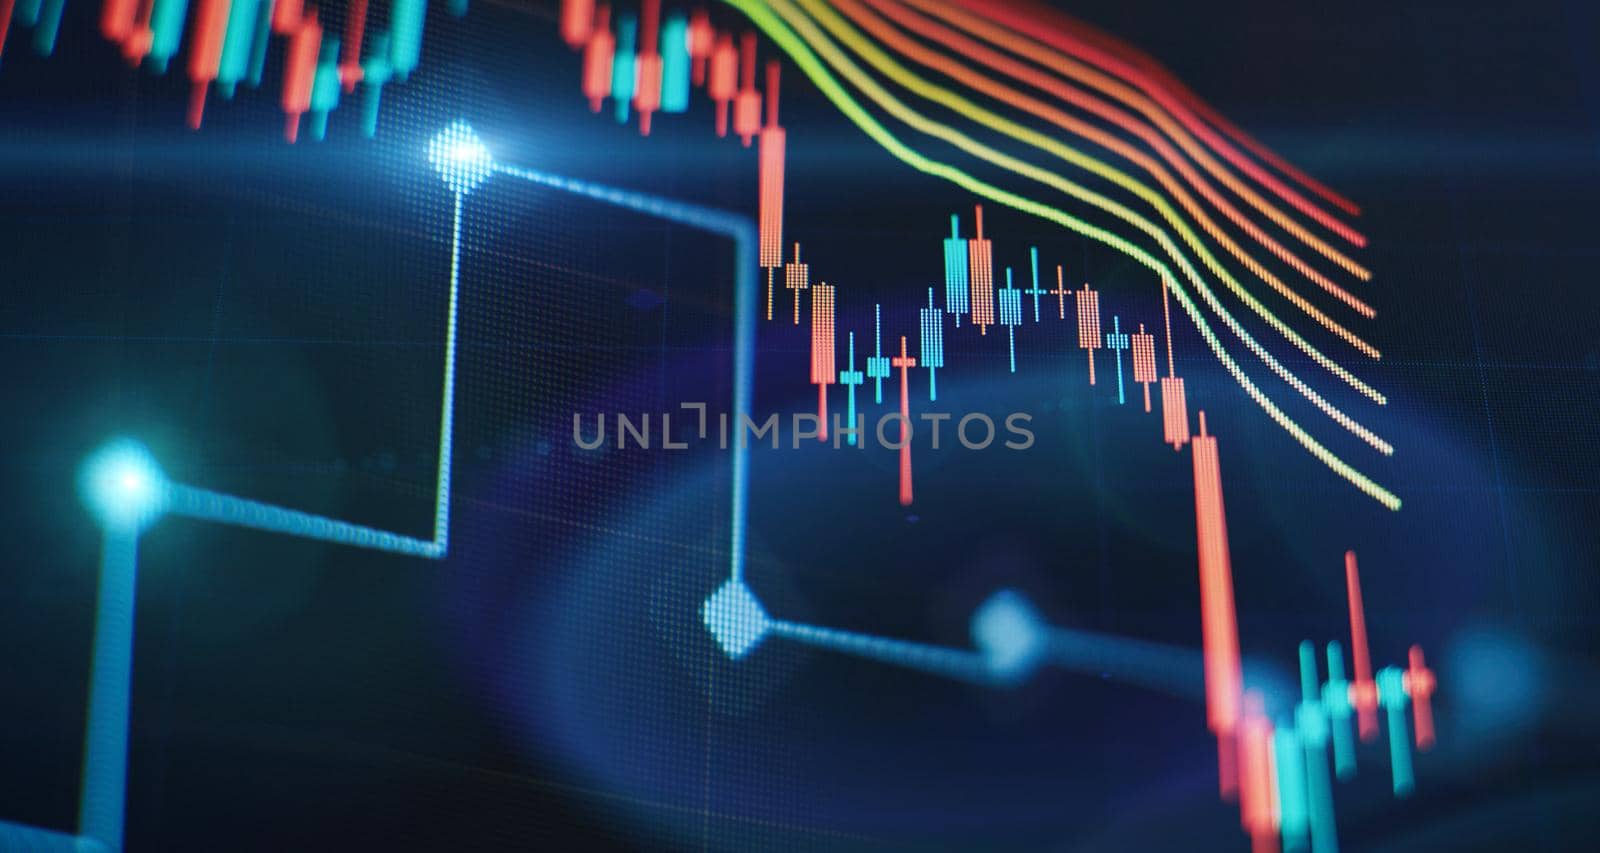
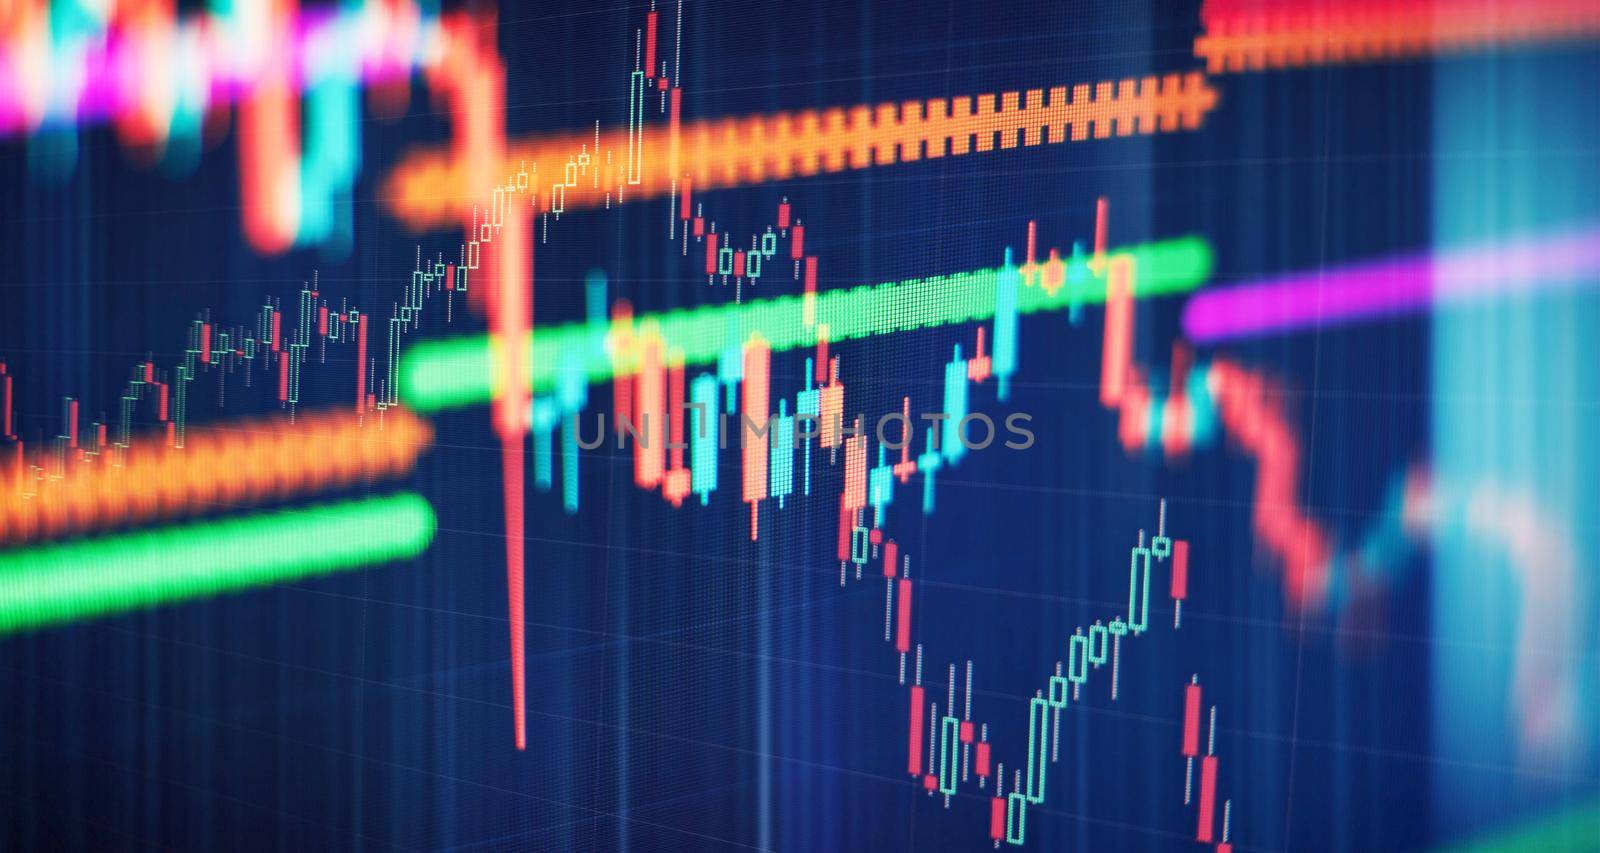
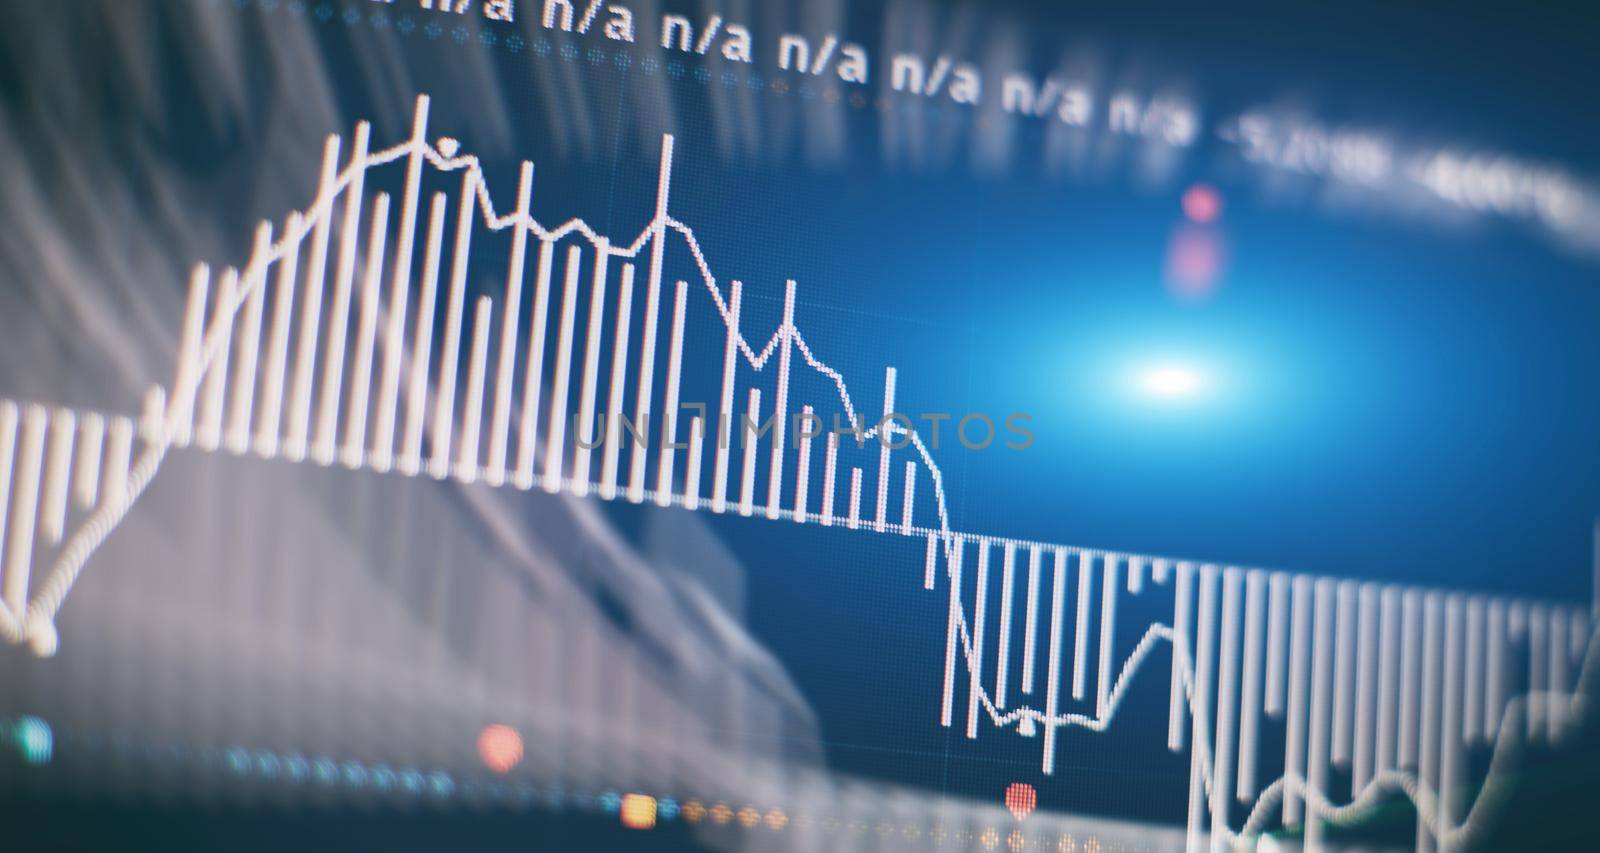
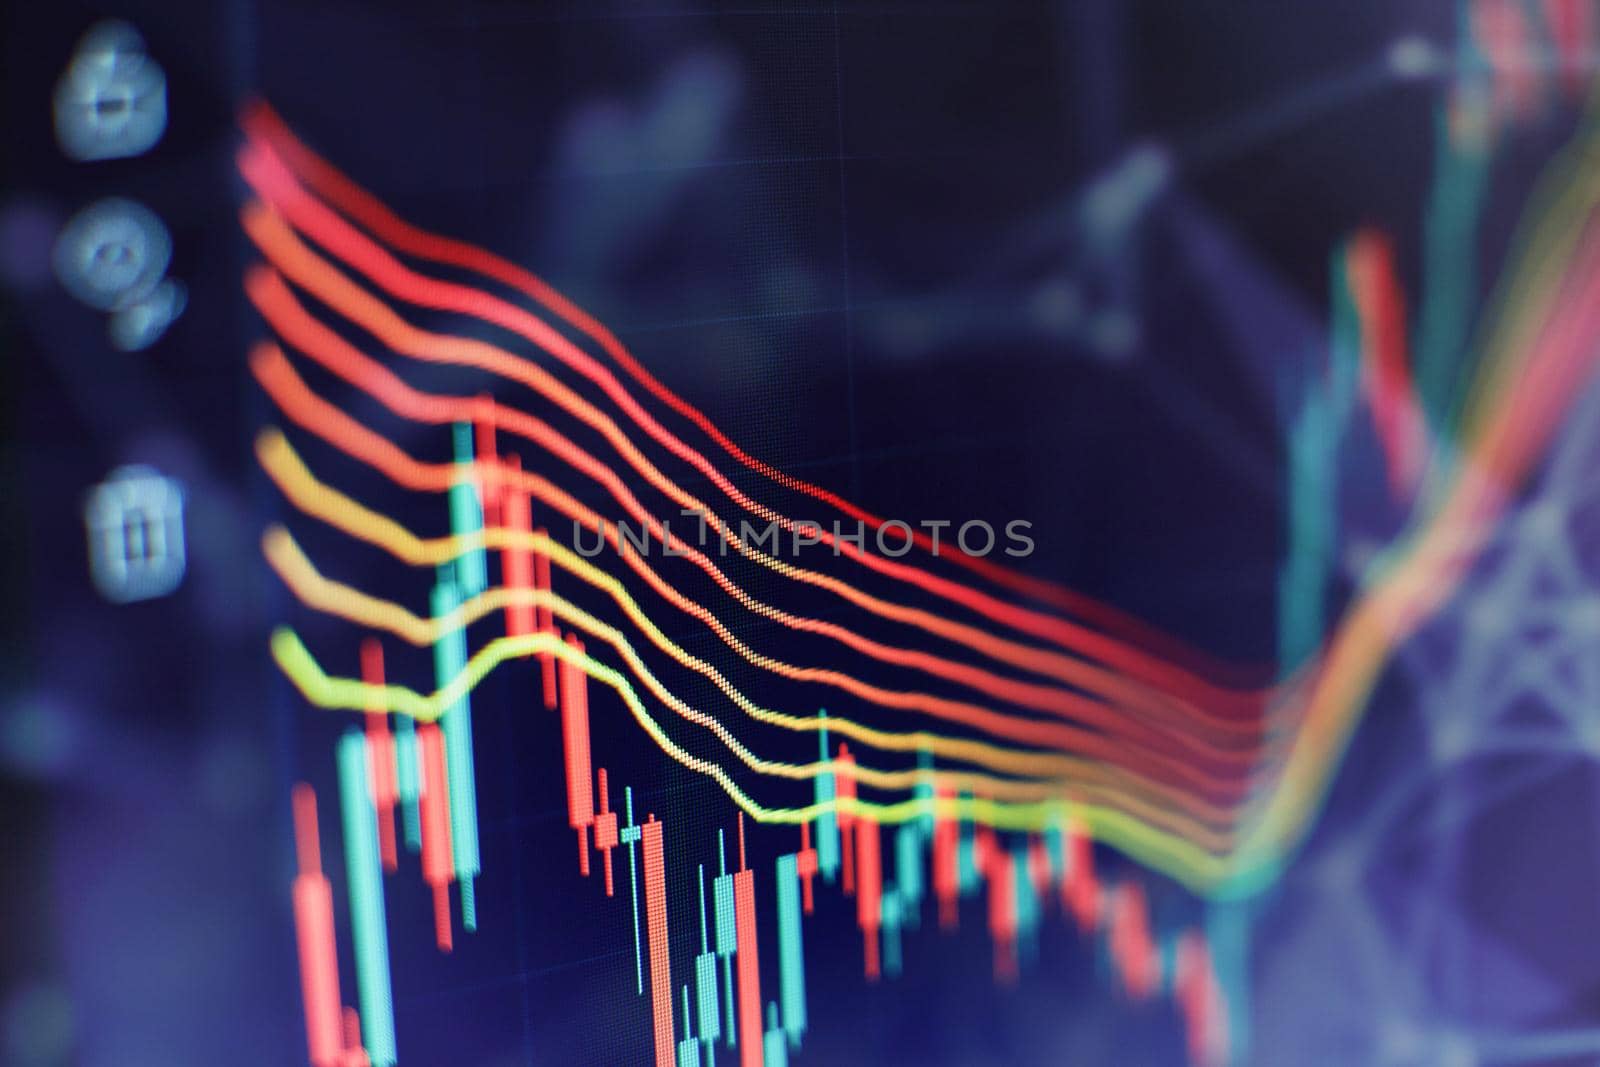
Market Analyze. Bar graphs, Diagrams, financial figures. Abstract glowing forex chart interface wallpaper. Investment, trade, stock, finance
Stock PhotoUsername
MaximusndResolution
8858x4724pxMarket Analyze. Bar graphs, Diagrams, financial figures. Abstract glowing forex chart interface wallpaper. Investment, trade, stock, finance
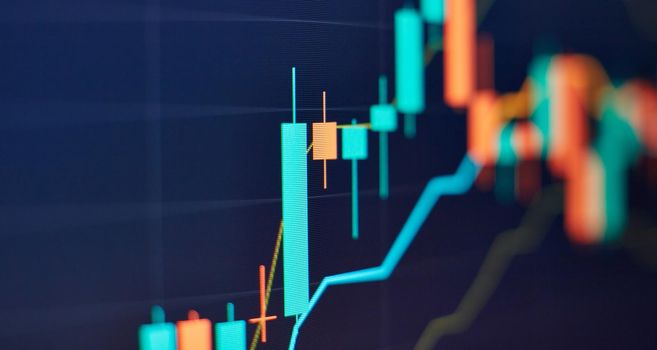
Stock market business graph chart on digital screen.Forex market, Gold market and Crude oil market .
Stock PhotoUsername
MaximusndResolution
8858x4724pxStock market business graph chart on digital screen.Forex market, Gold market and Crude oil market .


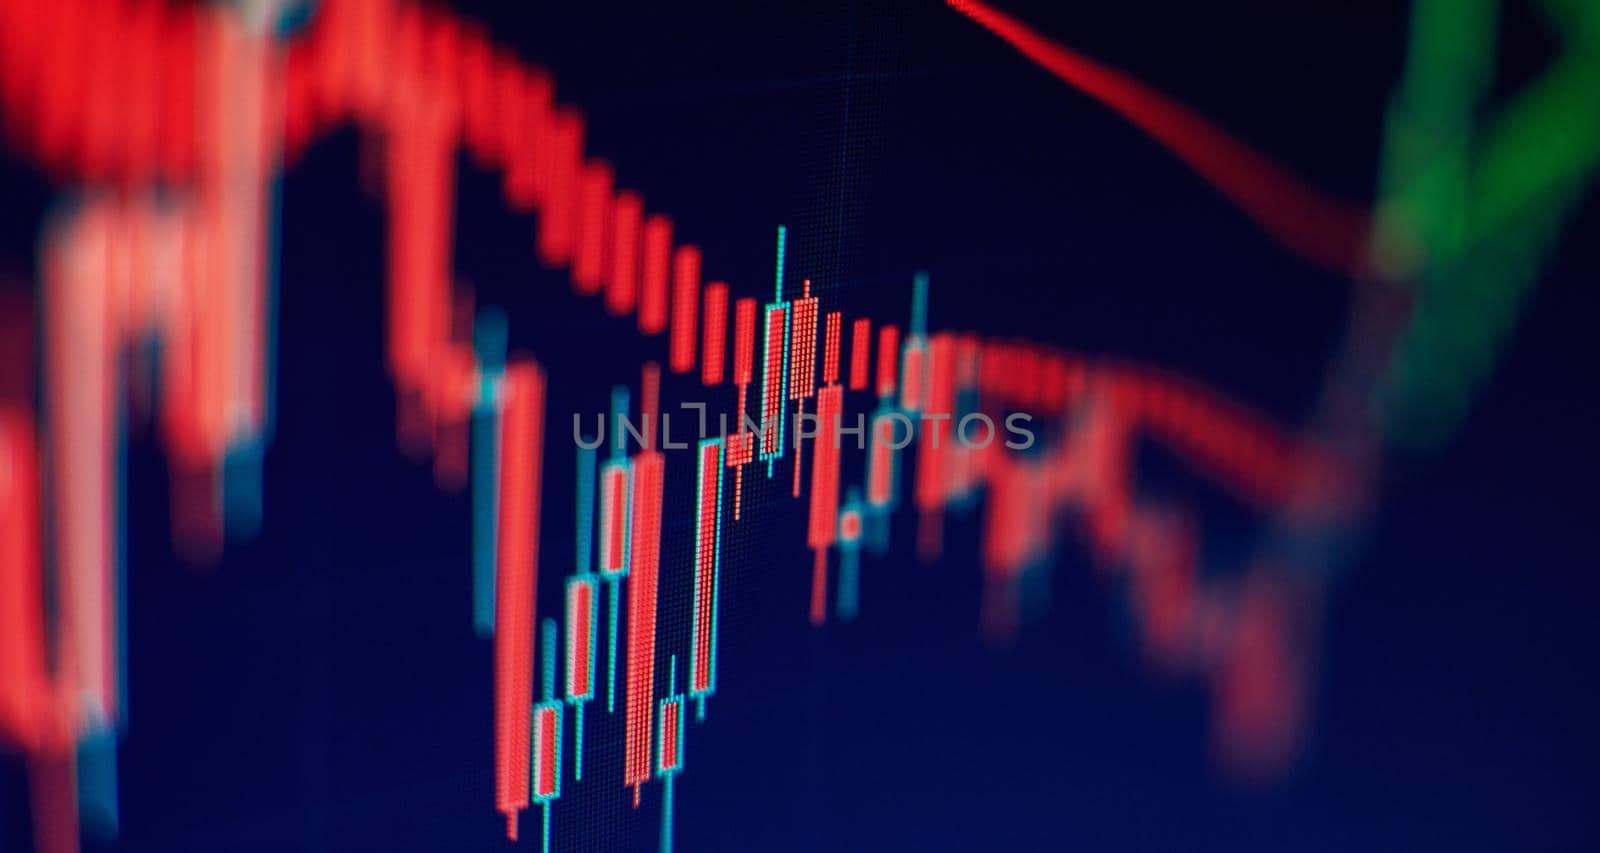
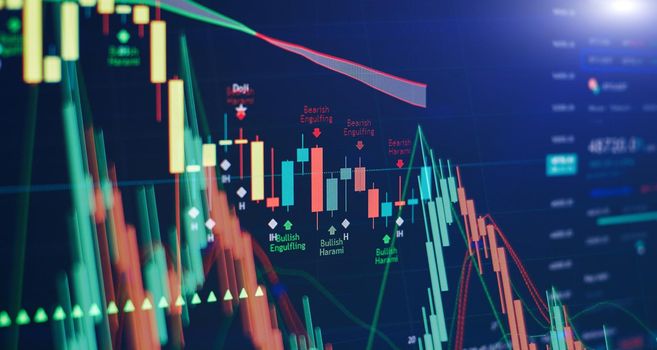
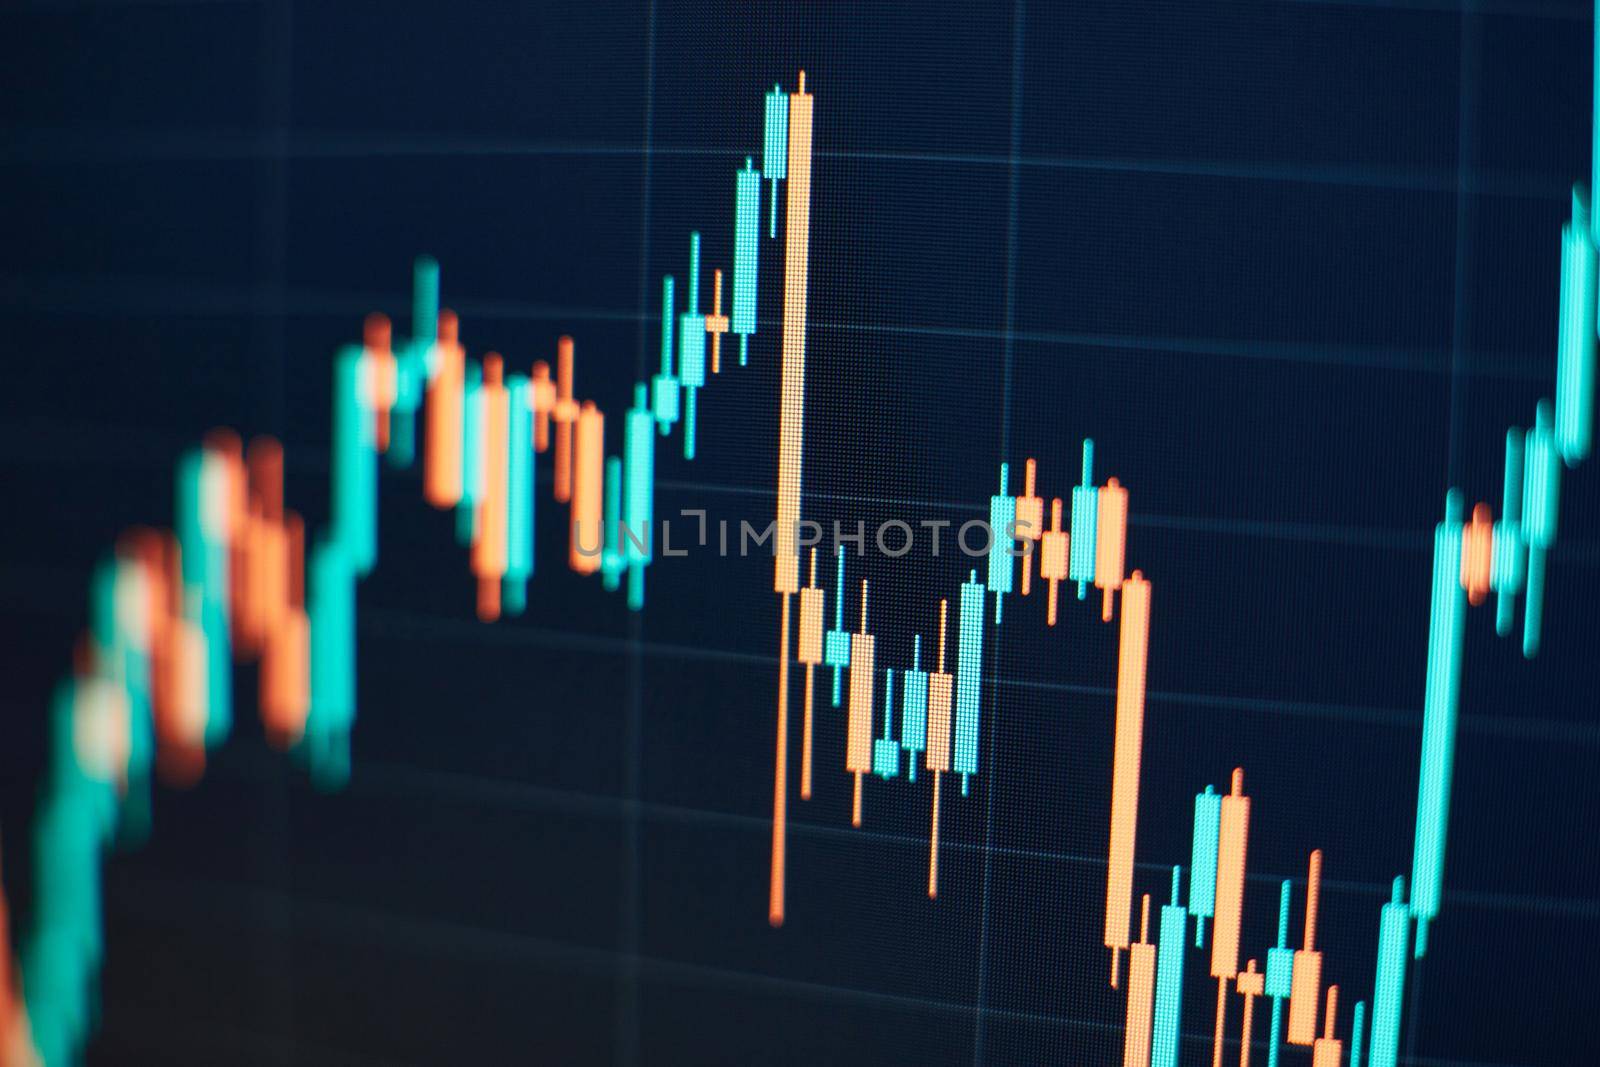
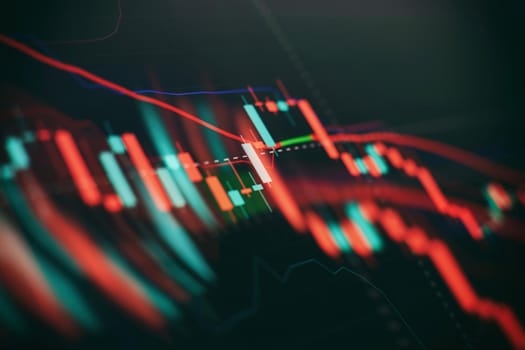
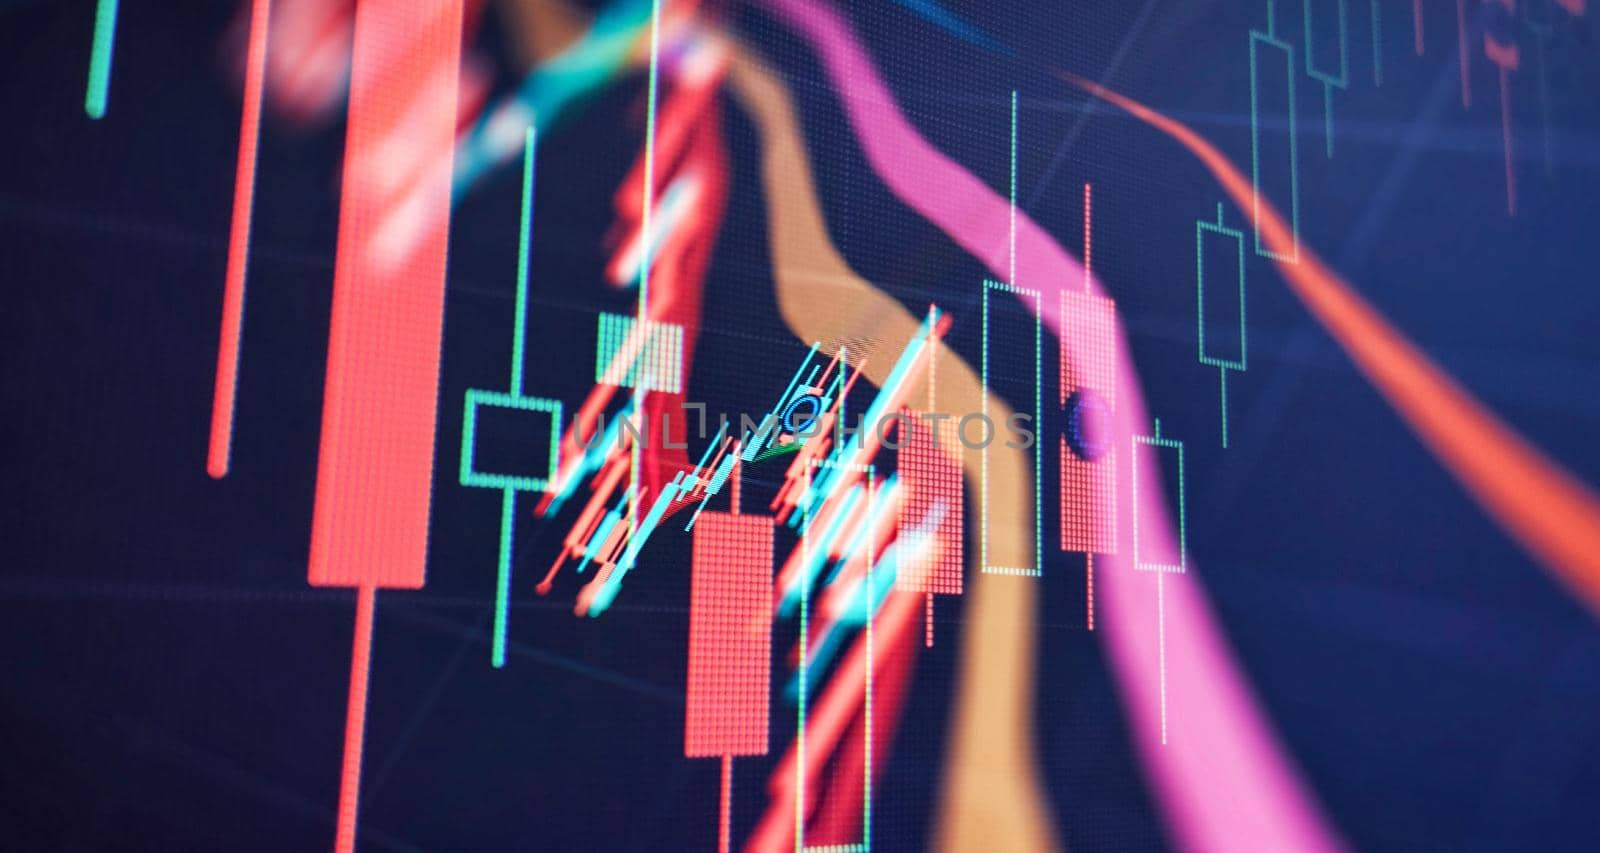
Technical price graph and indicator, red and green candlestick chart on blue theme screen, market volatility, up and down trend.
Stock PhotoUsername
MaximusndResolution
8858x4724pxTechnical price graph and indicator, red and green candlestick chart on blue theme screen, market volatility, up and down trend.

Stock market business graph chart on digital screen.Forex market, Gold market and Crude oil market .
Stock PhotoUsername
MaximusndResolution
8858x4724pxStock market business graph chart on digital screen.Forex market, Gold market and Crude oil market .
Technical price graph and indicator, red and green candlestick chart on blue theme screen, market volatility, up and down trend.
Stock PhotoUsername
MaximusndResolution
8858x4724pxTechnical price graph and indicator, red and green candlestick chart on blue theme screen, market volatility, up and down trend.

Businessman hand working on analyzing investment charts for Gold market, Forex market and Trading market.
Stock PhotoUsername
MaximusndResolution
8858x4724pxBusinessman hand working on analyzing investment charts for Gold market, Forex market and Trading market.

forex trading graph and candlestick chart suitable for financial investment concept. Economy trends background for business idea and all art work design. Abstract finance background.
Stock PhotoUsername
MaximusndResolution
8858x4724pxforex trading graph and candlestick chart suitable for financial investment concept. Economy trends background for business idea and all art work design. Abstract finance background.
Businessman hand working on analyzing investment charts for Gold market, Forex market and Trading market.
Stock PhotoUsername
MaximusndResolution
8858x4724pxBusinessman hand working on analyzing investment charts for Gold market, Forex market and Trading market.
Business graph and stock financial indicator. Stock or business market analysis concept.
Stock PhotoUsername
MaximusndResolution
5472x3648pxBusiness graph and stock financial indicator. Stock or business market analysis concept.

Business graph and stock financial indicator. Stock or business market analysis concept.
Stock PhotoUsername
MaximusndResolution
8858x4724pxBusiness graph and stock financial indicator. Stock or business market analysis concept.
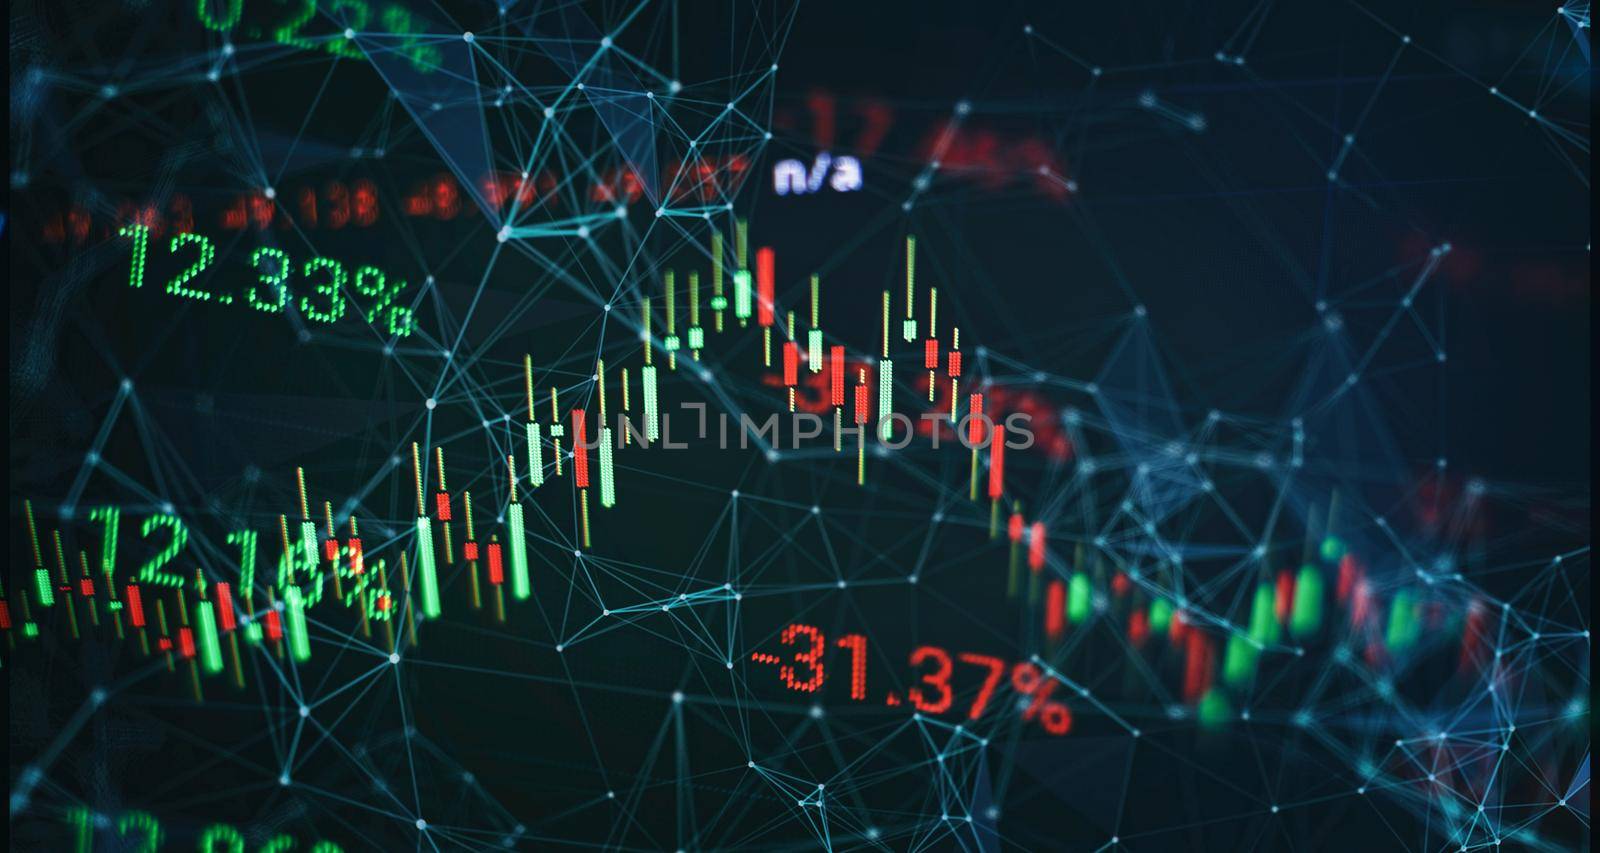
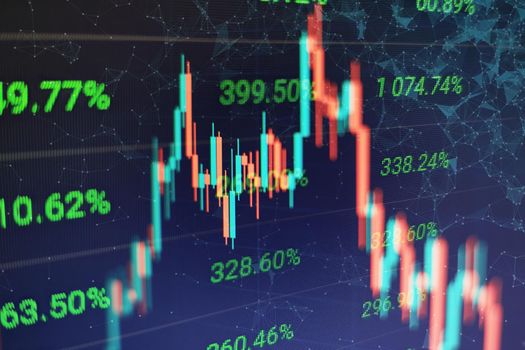
Economic growth, recession. Electronic virtual platform showing trends and stock market fluctuations
Stock PhotoUsername
MaximusndResolution
8858x4724pxEconomic growth, recession. Electronic virtual platform showing trends and stock market fluctuations

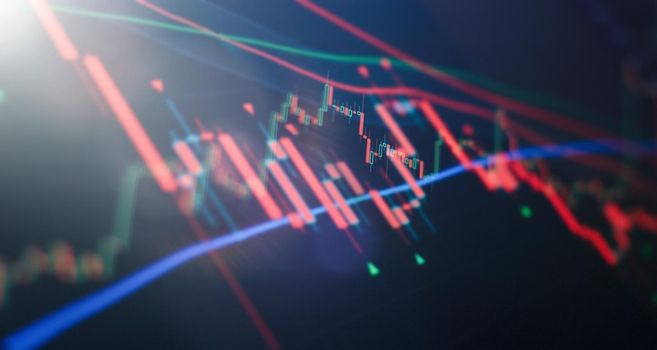
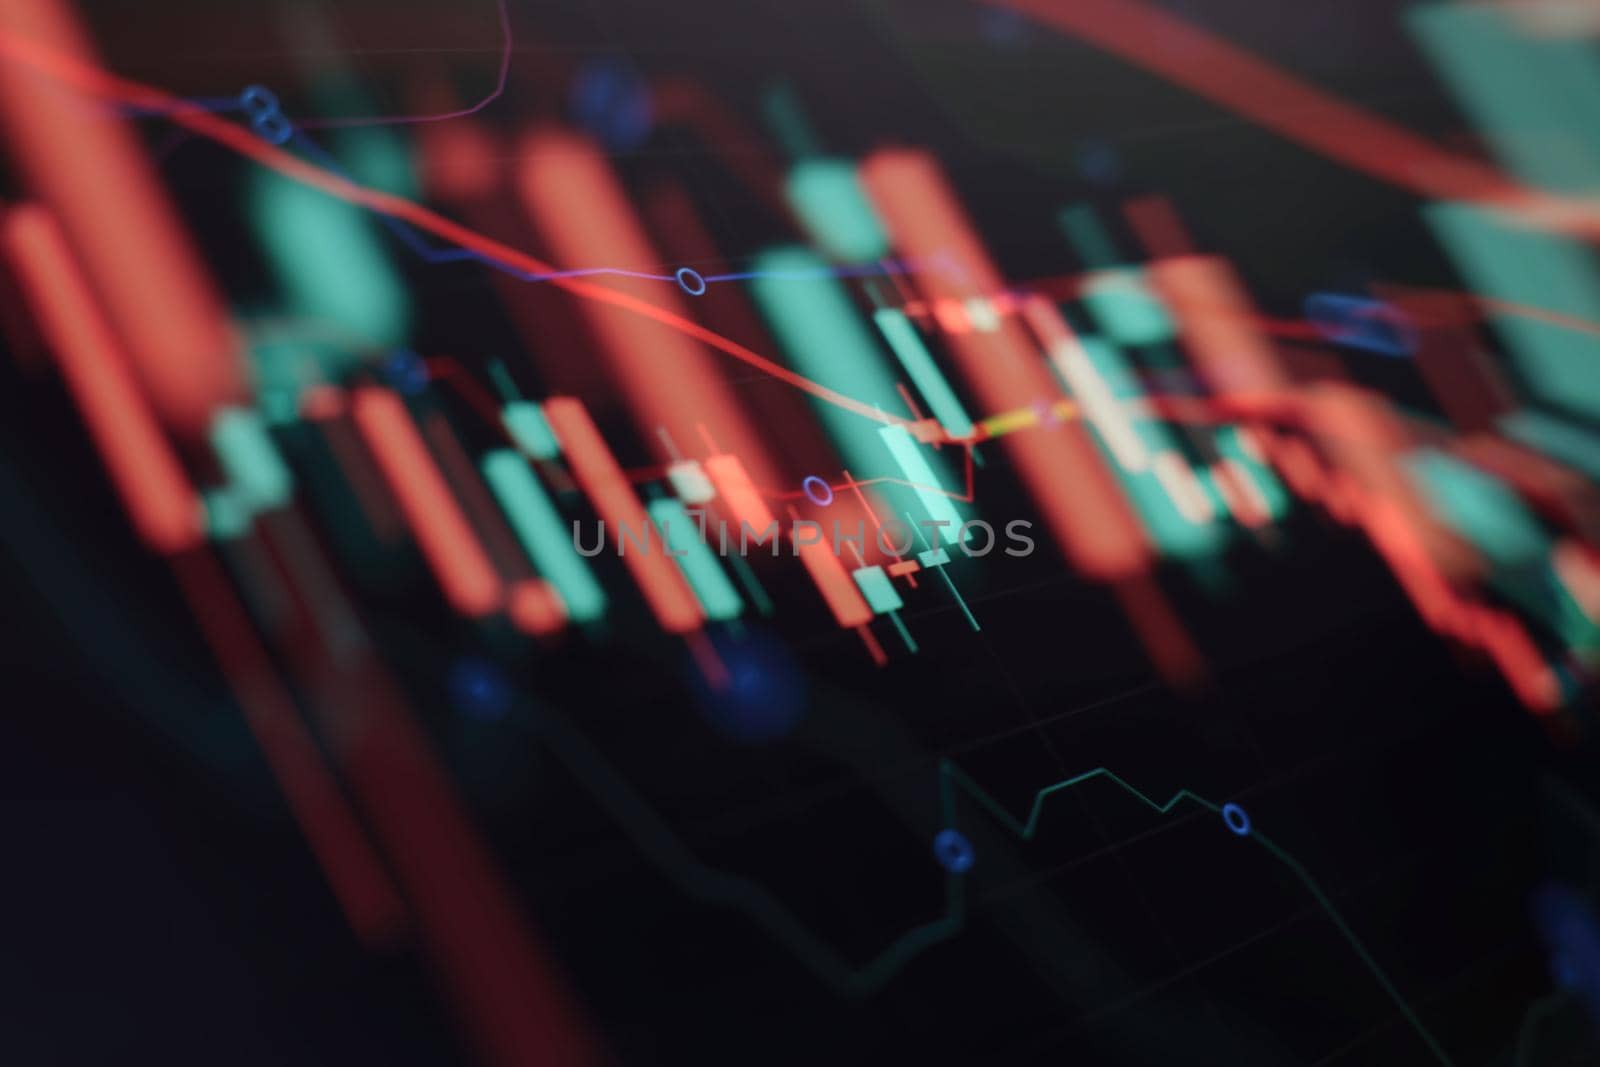
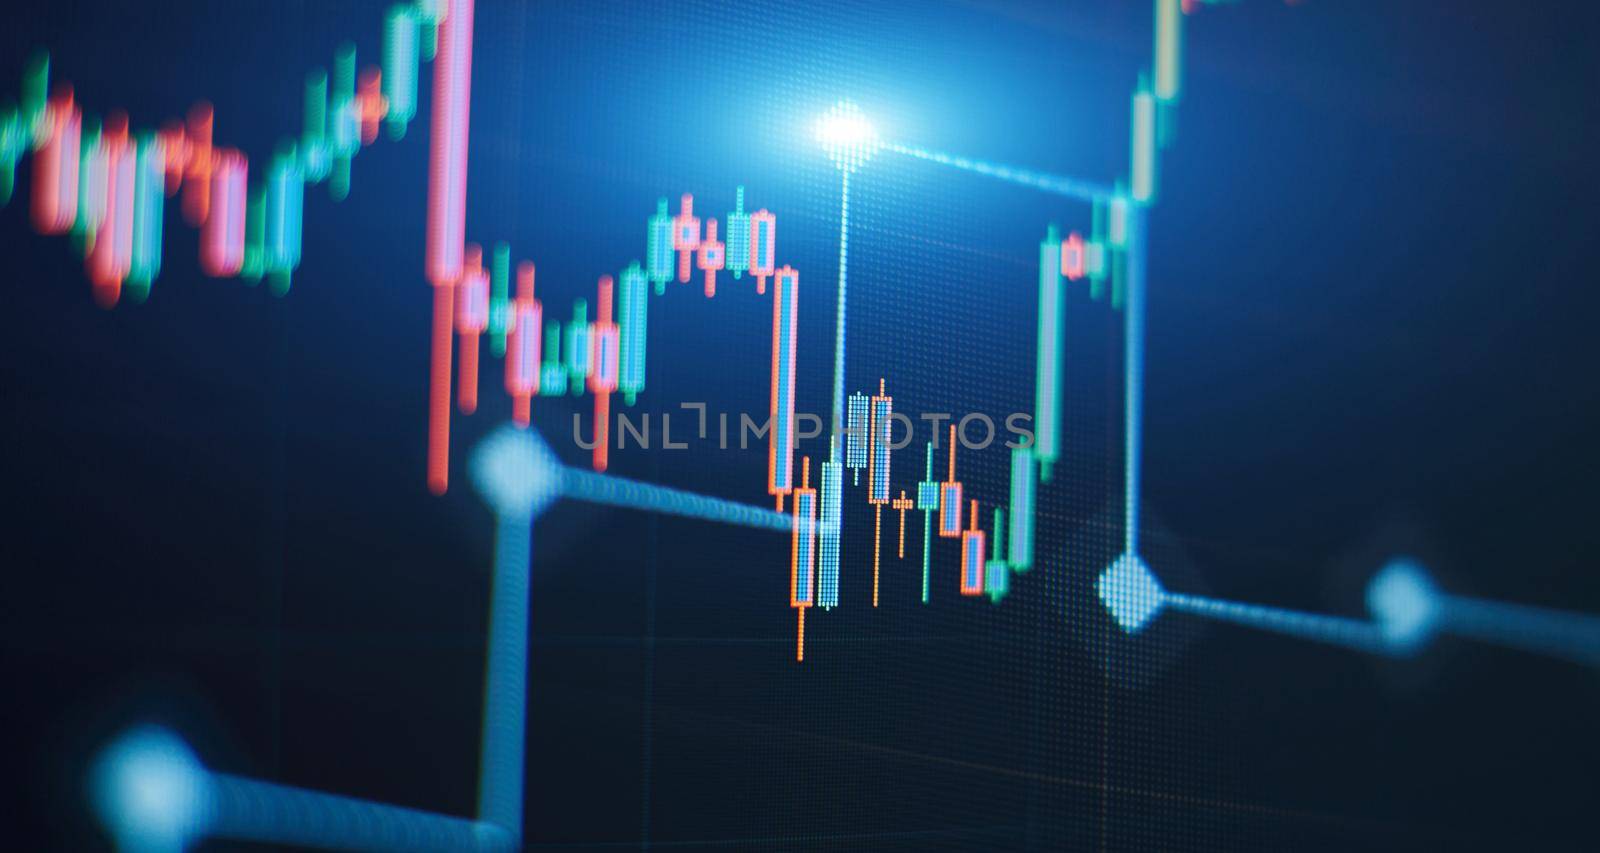
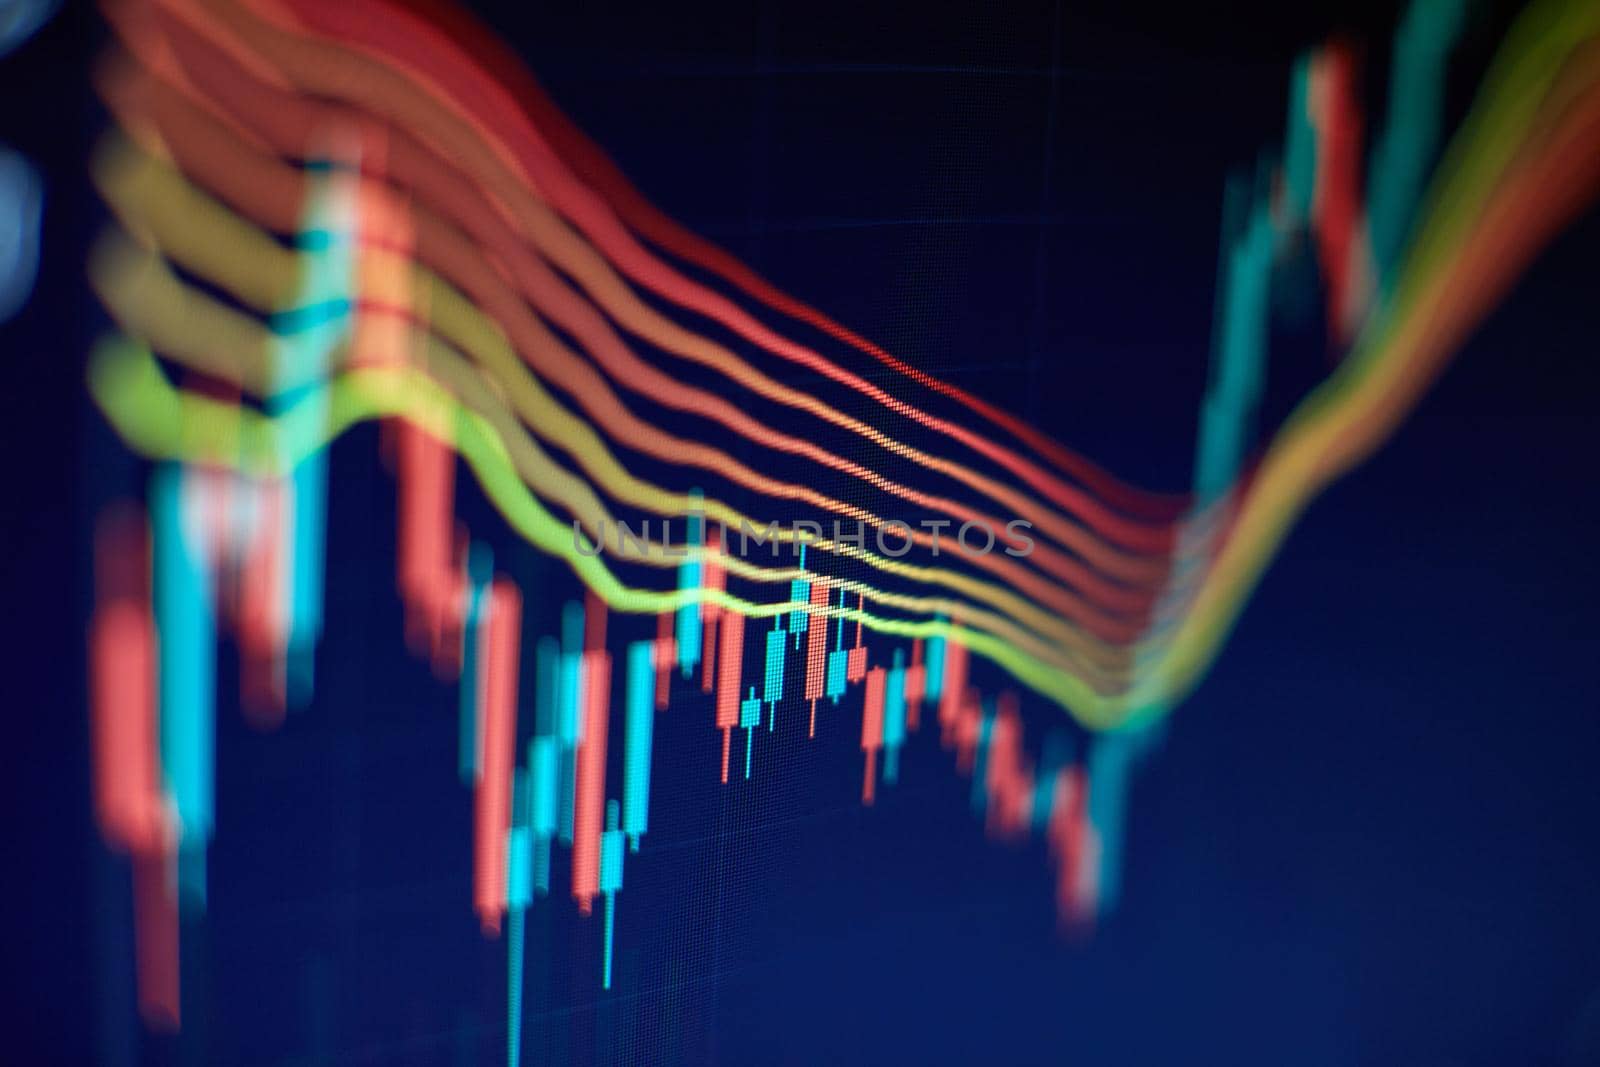
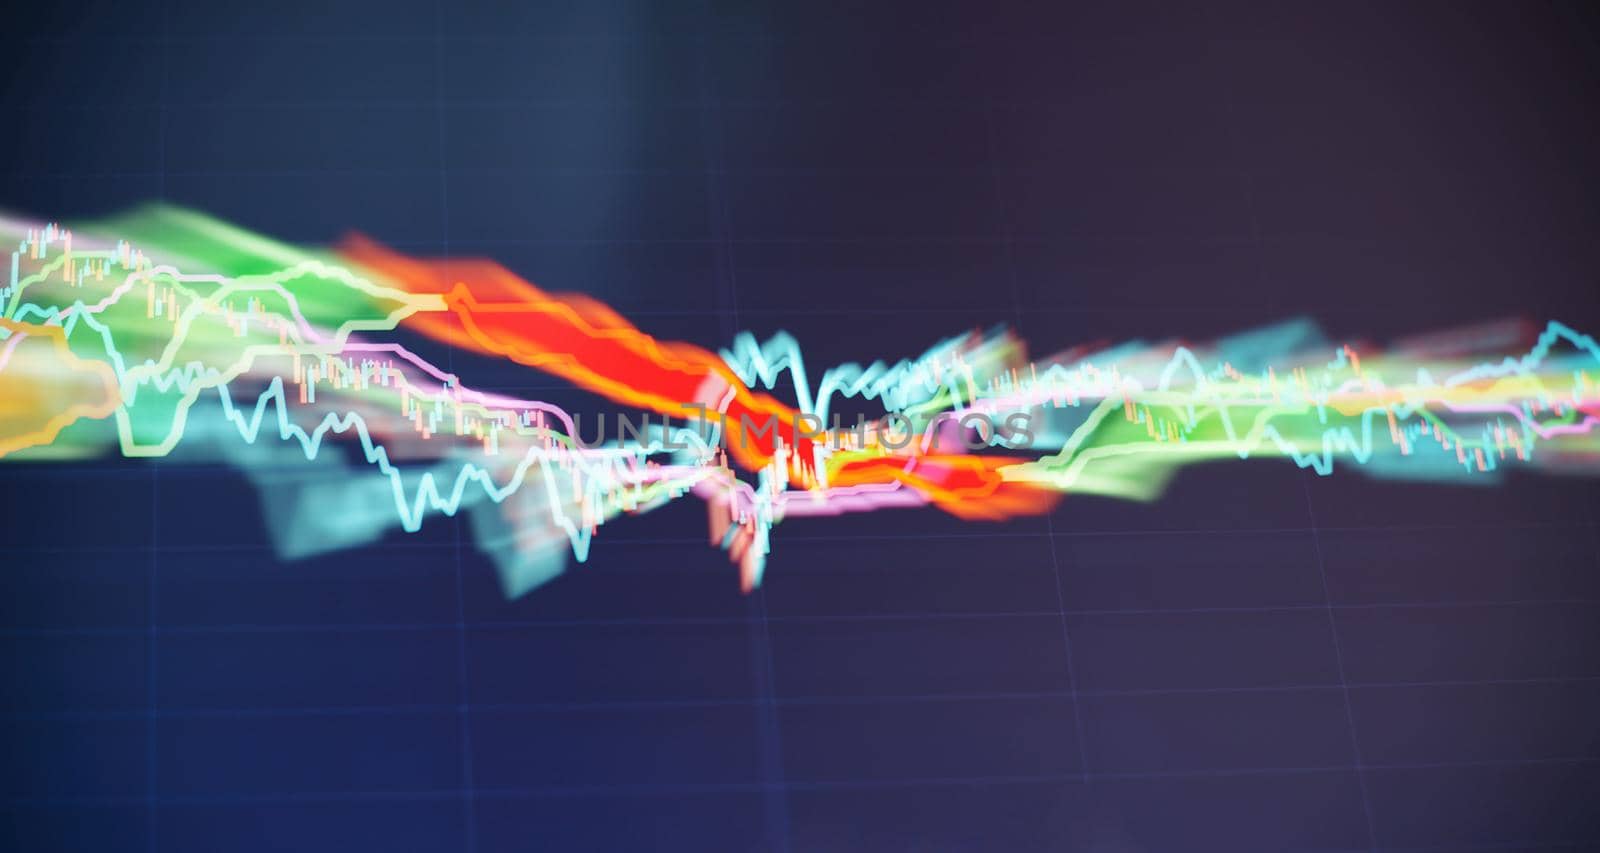
Concept of stock market and fintech. Blurry digital charts over dark blue background.
Stock PhotoUsername
MaximusndResolution
5472x3648pxConcept of stock market and fintech. Blurry digital charts over dark blue background.
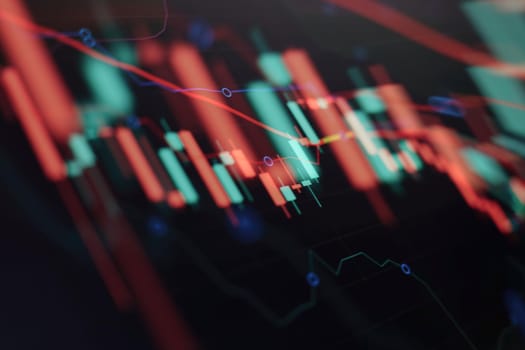
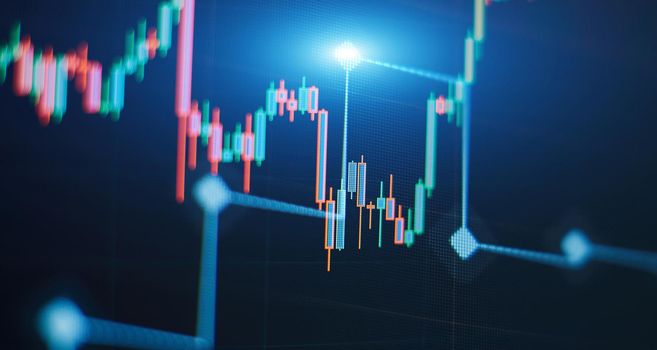
Concept of stock market and fintech. Blurry digital charts over dark blue background.
Stock PhotoUsername
MaximusndResolution
5472x3648pxConcept of stock market and fintech. Blurry digital charts over dark blue background.

Financial diagram with candlestick chart used in market analysis for variation report of share price
Stock PhotoUsername
MaximusndResolution
8858x4724pxFinancial diagram with candlestick chart used in market analysis for variation report of share price
Stock market business graph chart on digital screen.Forex market, Gold market and Crude oil market .
Stock PhotoUsername
MaximusndResolution
5472x3648pxStock market business graph chart on digital screen.Forex market, Gold market and Crude oil market .
Business graph and stock financial indicator. Stock or business market analysis concept.
Stock PhotoUsername
MaximusndResolution
5472x3648pxBusiness graph and stock financial indicator. Stock or business market analysis concept.
Market Analyze. Bar graphs, Diagrams, financial figures. Abstract glowing forex chart interface wallpaper. Investment, trade, stock, finance
Stock PhotoUsername
MaximusndResolution
8858x4724pxMarket Analyze. Bar graphs, Diagrams, financial figures. Abstract glowing forex chart interface wallpaper. Investment, trade, stock, finance

Business graph and stock financial indicator. Stock or business market analysis concept.
Stock PhotoUsername
MaximusndResolution
8858x4724pxBusiness graph and stock financial indicator. Stock or business market analysis concept.
Business graph and stock financial indicator. Stock or business market analysis concept.
Stock PhotoUsername
MaximusndResolution
5472x3648pxBusiness graph and stock financial indicator. Stock or business market analysis concept.
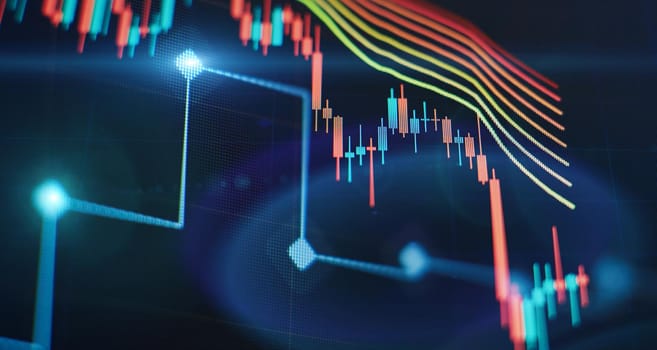
Market Analyze. Bar graphs, Diagrams, financial figures. Abstract glowing forex chart interface wallpaper. Investment, trade, stock, finance
Stock PhotoUsername
MaximusndResolution
5472x3648pxMarket Analyze. Bar graphs, Diagrams, financial figures. Abstract glowing forex chart interface wallpaper. Investment, trade, stock, finance
Economy trends background for business idea and all art work design. Abstract finance background.
Stock PhotoUsername
MaximusndResolution
8858x4724pxEconomy trends background for business idea and all art work design. Abstract finance background.
Concept of stock market and fintech. Blurry digital charts over dark blue background.
Stock PhotoUsername
MaximusndResolution
5472x3648pxConcept of stock market and fintech. Blurry digital charts over dark blue background.
Business graph and stock financial indicator. Stock or business market analysis concept.
Stock PhotoUsername
MaximusndResolution
8858x4724pxBusiness graph and stock financial indicator. Stock or business market analysis concept.
Economy trends background for business idea and all art work design. Abstract finance background.
Stock PhotoUsername
MaximusndResolution
8858x4724pxEconomy trends background for business idea and all art work design. Abstract finance background.

Economy trends background for business idea and all art work design. Abstract finance background.
Stock PhotoUsername
MaximusndResolution
8858x4724pxEconomy trends background for business idea and all art work design. Abstract finance background.
Concept of stock market and fintech. Blurry digital charts over dark blue background.
Stock PhotoUsername
MaximusndResolution
8858x4724pxConcept of stock market and fintech. Blurry digital charts over dark blue background.

The business plan at the meeting and analyze financial numbers to view the performance of the company.
Stock PhotoUsername
MaximusndResolution
8858x4724pxThe business plan at the meeting and analyze financial numbers to view the performance of the company.
Data on a monitor which including of Market Analyze. Bar graphs, Diagrams, financial figures.
Stock PhotoUsername
MaximusndResolution
8858x4724pxData on a monitor which including of Market Analyze. Bar graphs, Diagrams, financial figures.

Stock market investment trading. The Forex graph chart on the digital screen.
Stock PhotoUsername
MaximusndResolution
8858x4724pxStock market investment trading. The Forex graph chart on the digital screen.
Stock market business graph chart on digital screen.Forex market, Gold market and Crude oil market .
Stock PhotoUsername
MaximusndResolution
8858x4724pxStock market business graph chart on digital screen.Forex market, Gold market and Crude oil market .
Abstract financial graph with candle stick and bar chart of stock market on financialbackground
Stock PhotoUsername
MaximusndResolution
8858x4724pxAbstract financial graph with candle stick and bar chart of stock market on financialbackground

Market Analyze. Bar graphs, Diagrams, financial figures. Abstract glowing forex chart interface wallpaper. Investment, trade, stock, finance
Stock PhotoUsername
MaximusndResolution
8858x4724pxMarket Analyze. Bar graphs, Diagrams, financial figures. Abstract glowing forex chart interface wallpaper. Investment, trade, stock, finance

Economic graph with diagrams on the stock market, for business and financial concepts
Stock PhotoUsername
MaximusndResolution
8858x4724pxEconomic graph with diagrams on the stock market, for business and financial concepts

Market Analyze. Bar graphs, Diagrams, financial figures. Abstract glowing forex chart interface wallpaper. Investment, trade, stock, finance
Stock PhotoUsername
MaximusndResolution
8858x4724pxMarket Analyze. Bar graphs, Diagrams, financial figures. Abstract glowing forex chart interface wallpaper. Investment, trade, stock, finance
Abstract financial graph with candle stick and bar chart of stock market on financialbackground
Stock PhotoUsername
MaximusndResolution
8858x4724pxAbstract financial graph with candle stick and bar chart of stock market on financialbackground


Economic graph with diagrams on the stock market, for business and financial concepts
Stock PhotoUsername
MaximusndResolution
8858x4724pxEconomic graph with diagrams on the stock market, for business and financial concepts
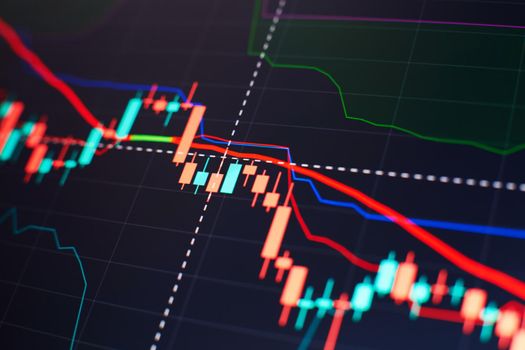
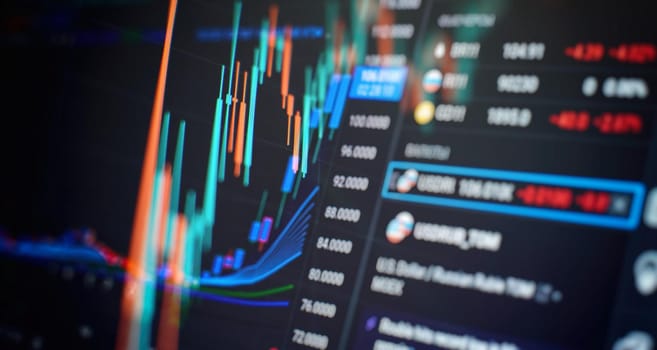
Charts of financial instruments with various type of indicators including volume analysis for professional technical analysis on the monitor of a computer.
Stock PhotoUsername
MaximusndResolution
5472x3648pxCharts of financial instruments with various type of indicators including volume analysis for professional technical analysis on the monitor of a computer.
Economic graph with diagrams on the stock market, for business and financial concepts
Stock PhotoUsername
MaximusndResolution
8858x4724pxEconomic graph with diagrams on the stock market, for business and financial concepts
Market Analyze. Bar graphs, Diagrams, financial figures. Abstract glowing forex chart interface wallpaper. Investment, trade, stock, finance
Stock PhotoUsername
MaximusndResolution
5472x3648pxMarket Analyze. Bar graphs, Diagrams, financial figures. Abstract glowing forex chart interface wallpaper. Investment, trade, stock, finance


Charts of financial instruments with various type of indicators including volume analysis for professional technical analysis on the monitor of a computer.
Stock PhotoUsername
MaximusndResolution
8858x4724pxCharts of financial instruments with various type of indicators including volume analysis for professional technical analysis on the monitor of a computer.
Abstract financial graph with candle stick and bar chart of stock market on financialbackground
Stock PhotoUsername
MaximusndResolution
8858x4724pxAbstract financial graph with candle stick and bar chart of stock market on financialbackground

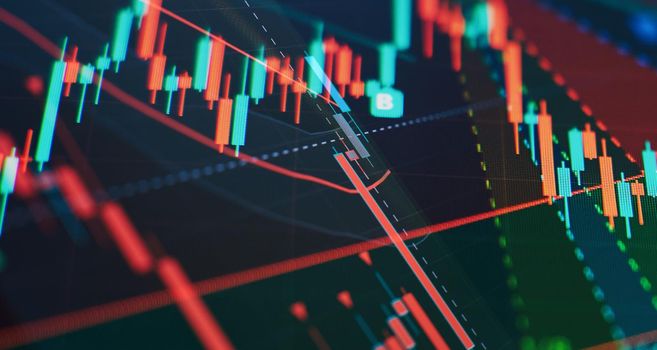
Technical price graph and indicator, red and green candlestick chart on blue theme screen, market volatility, up and down trend. Stock trading, crypto currency background.
Stock PhotoUsername
MaximusndResolution
8858x4724pxTechnical price graph and indicator, red and green candlestick chart on blue theme screen, market volatility, up and down trend. Stock trading, crypto currency background.

Market Analyze. Bar graphs, Diagrams, financial figures. Abstract glowing forex chart interface wallpaper. Investment, trade, stock, finance
Stock PhotoUsername
MaximusndResolution
5472x3648pxMarket Analyze. Bar graphs, Diagrams, financial figures. Abstract glowing forex chart interface wallpaper. Investment, trade, stock, finance


Concept of stock market and fintech. Blurry digital charts over dark blue background.
Stock PhotoUsername
MaximusndResolution
8858x4724pxConcept of stock market and fintech. Blurry digital charts over dark blue background.