- Filter By:
-
-
Stock photos and images of technology
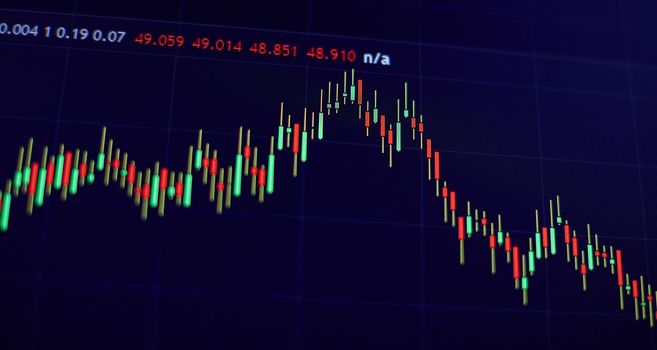
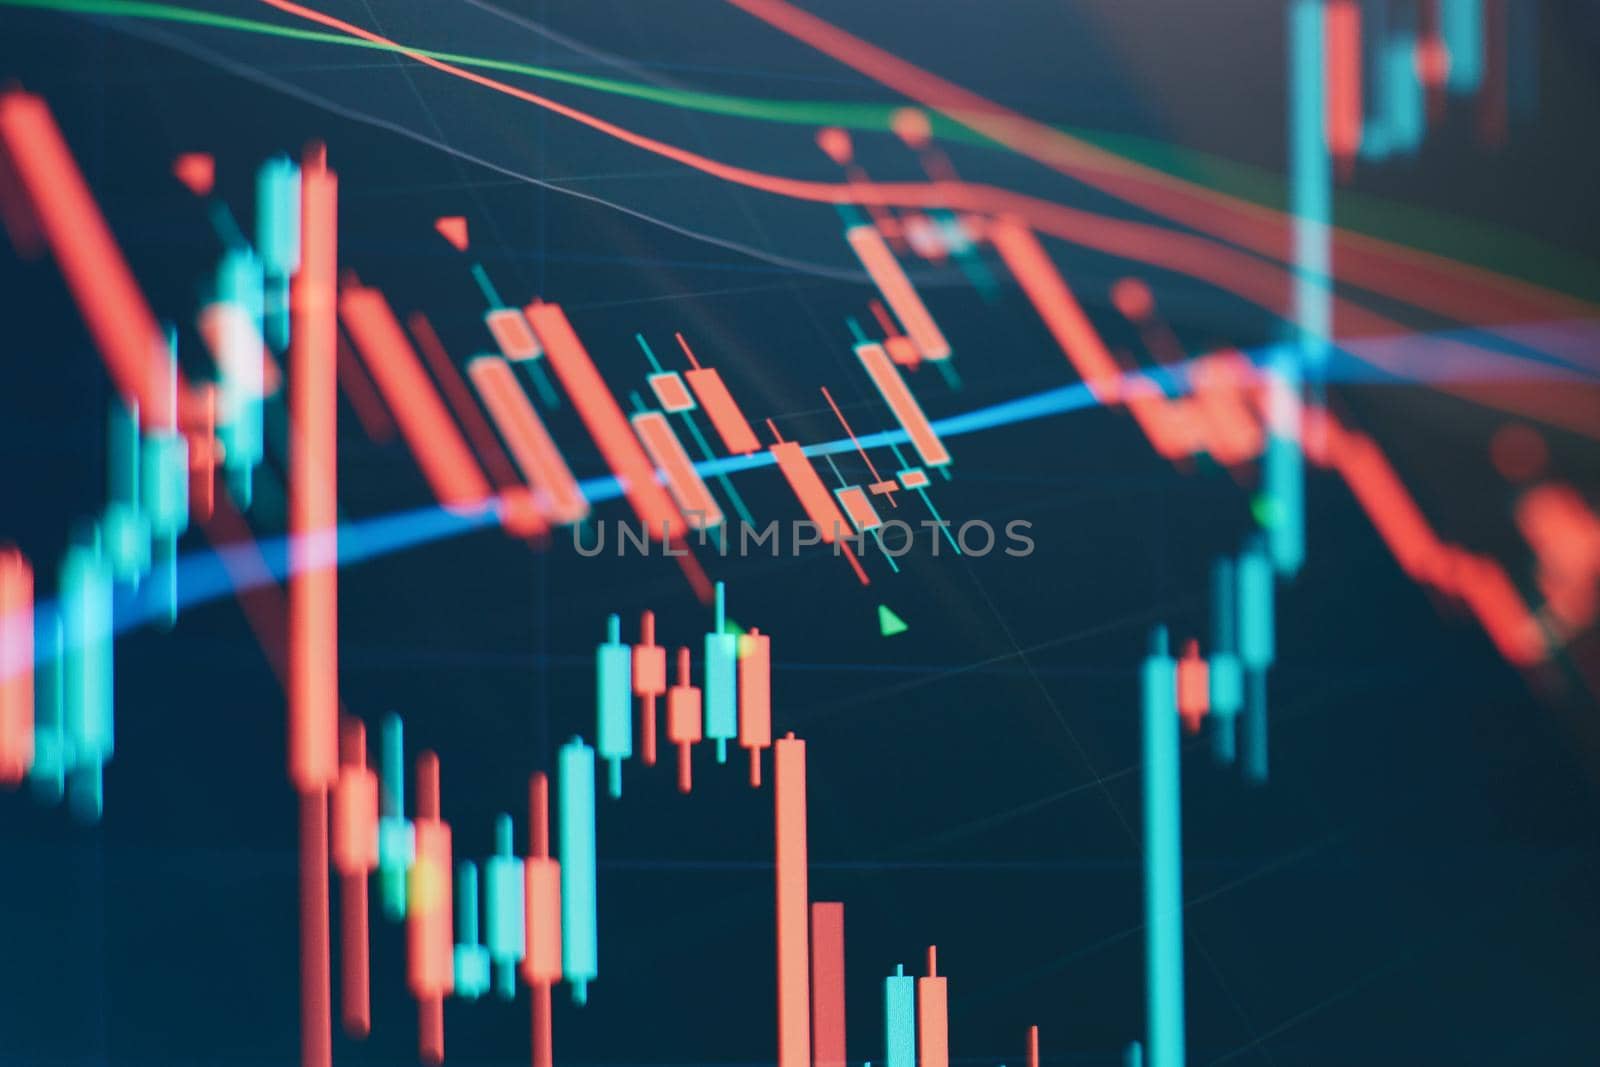
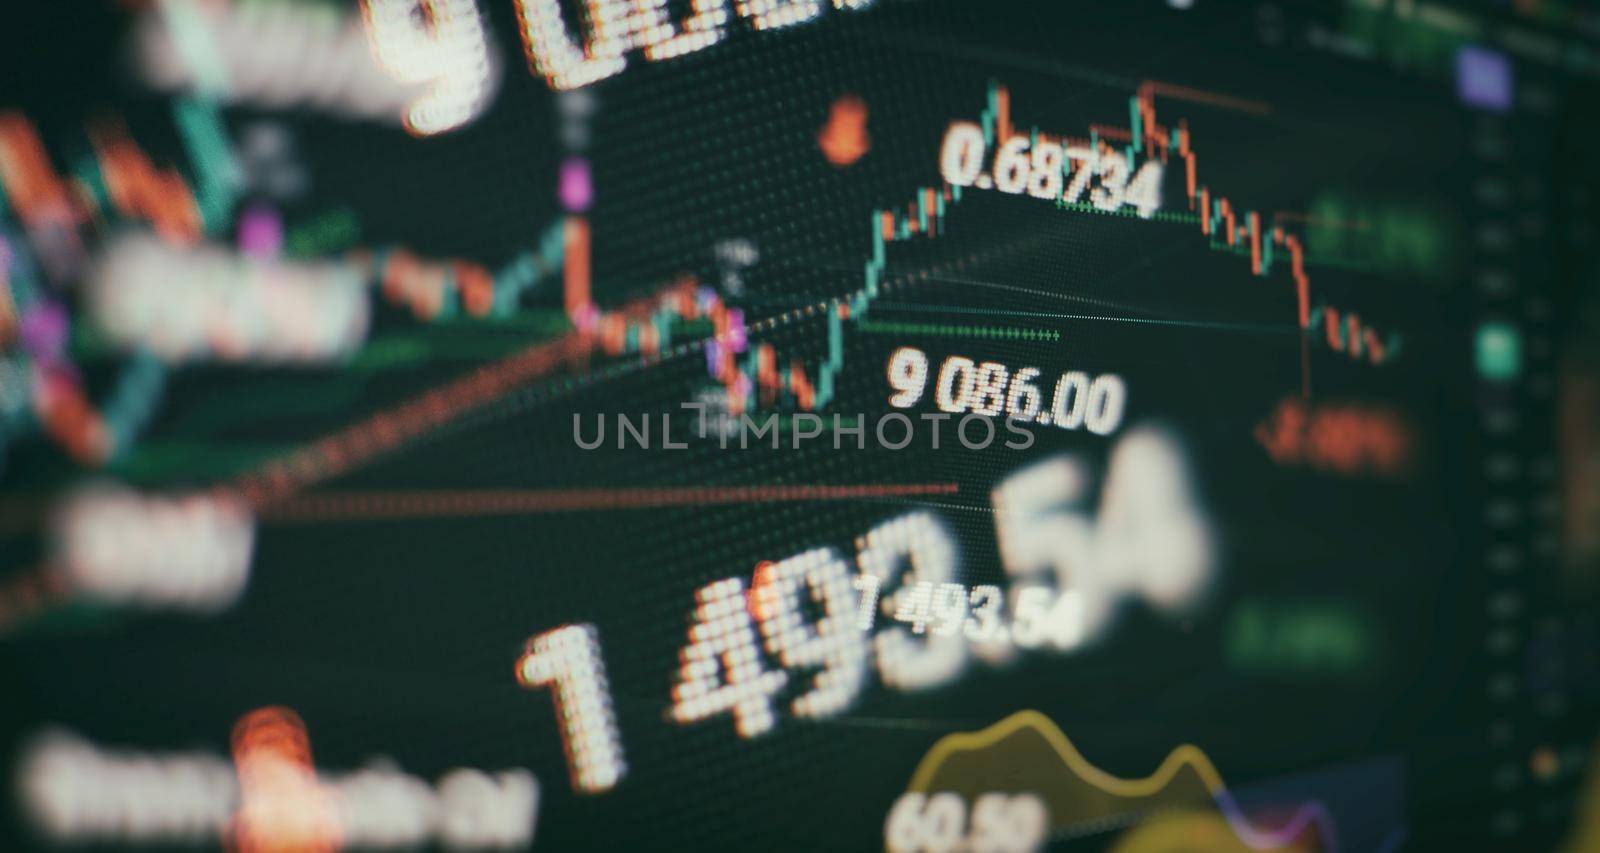
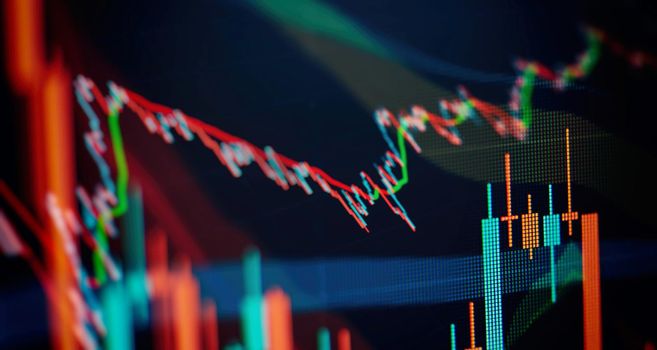
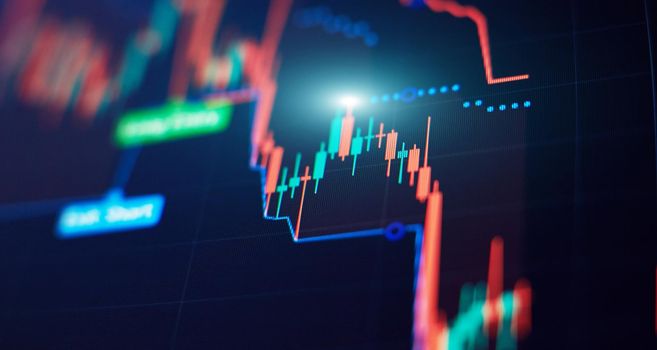
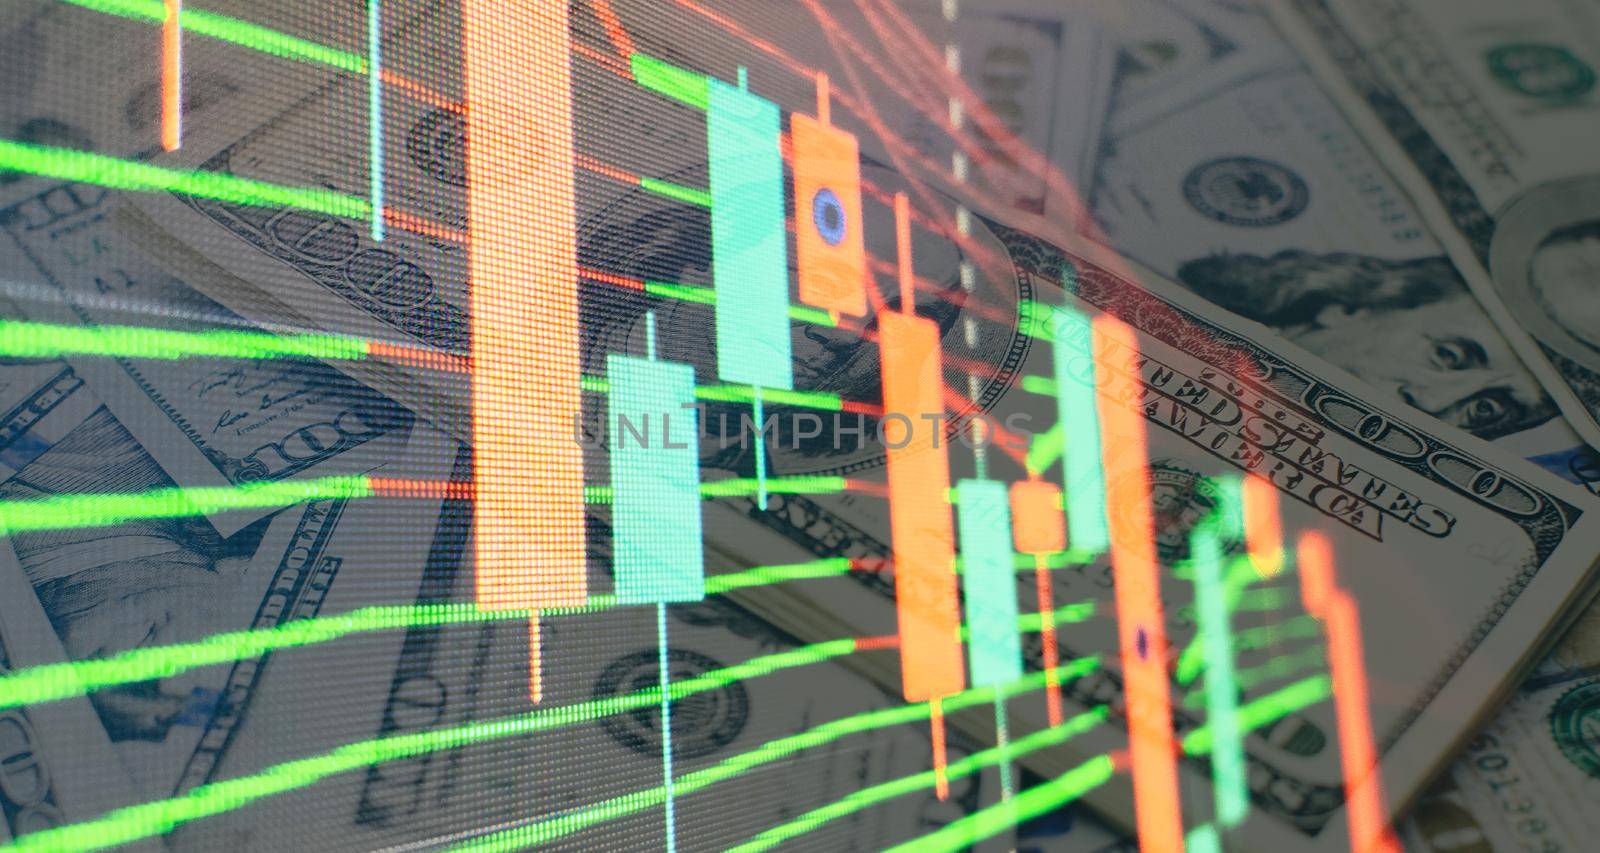
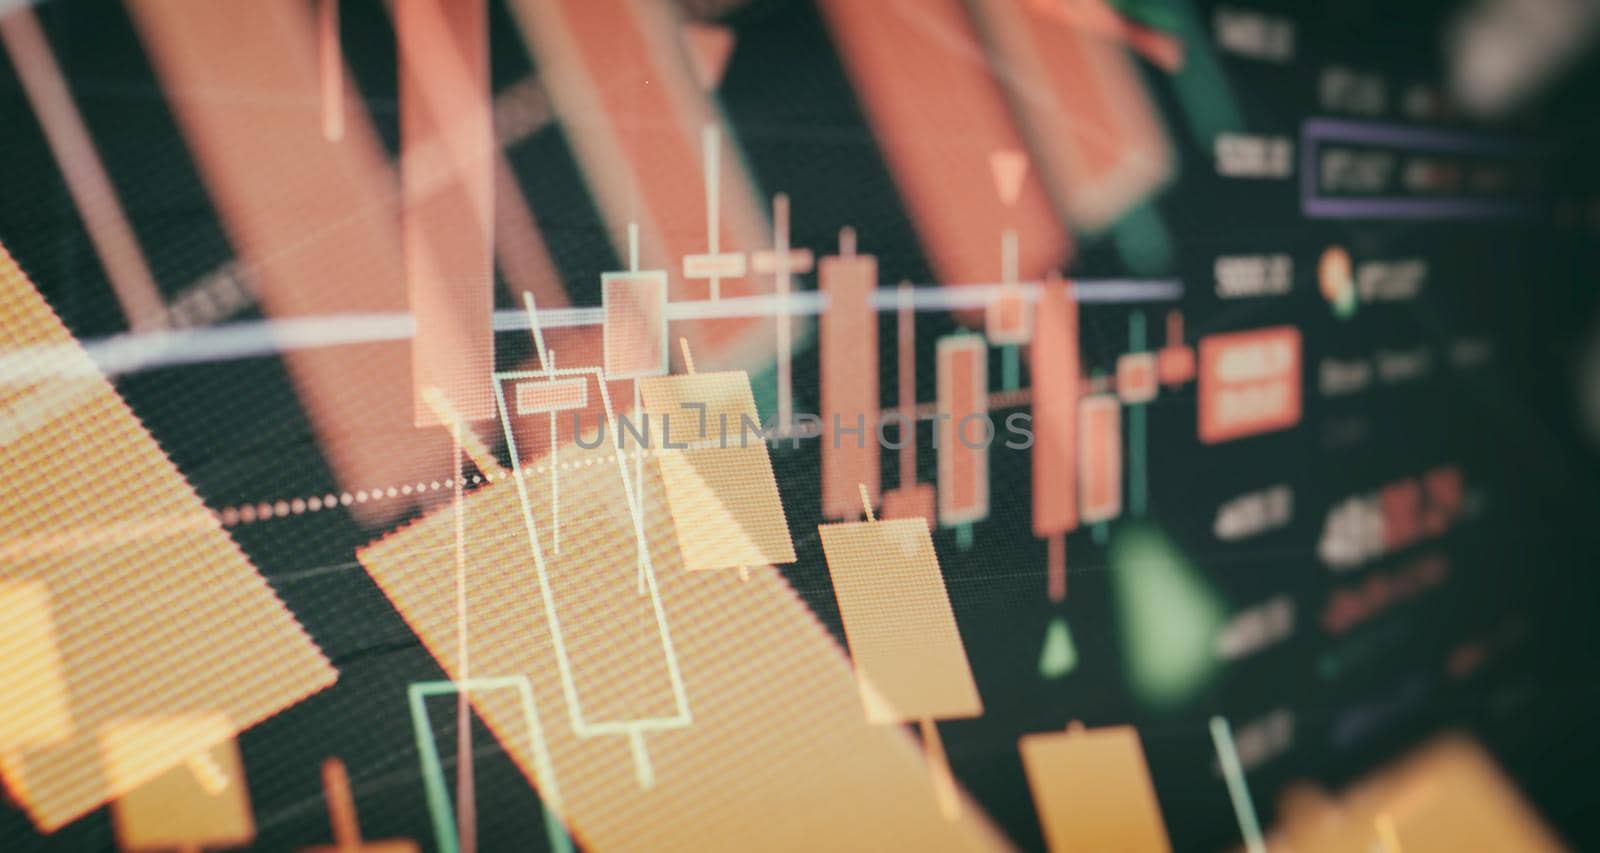
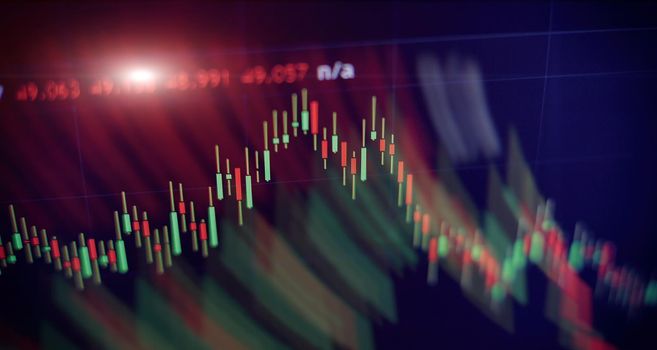
Economic growth, recession. Electronic virtual platform showing trends and stock market fluctuations
Stock PhotoUsername
MaximusndResolution
8858x4724pxEconomic growth, recession. Electronic virtual platform showing trends and stock market fluctuations

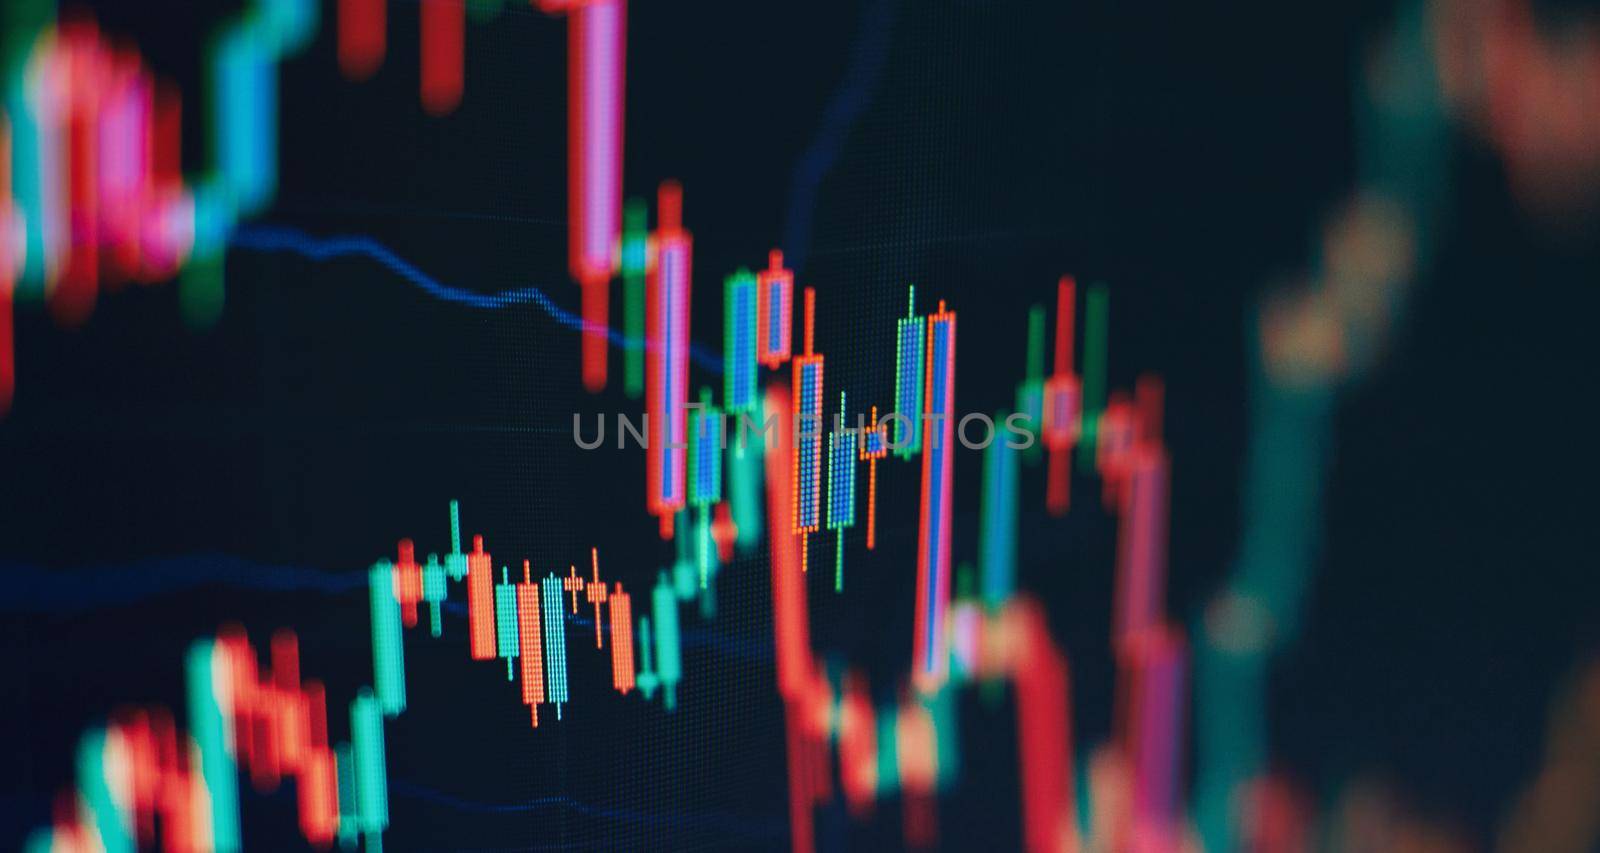
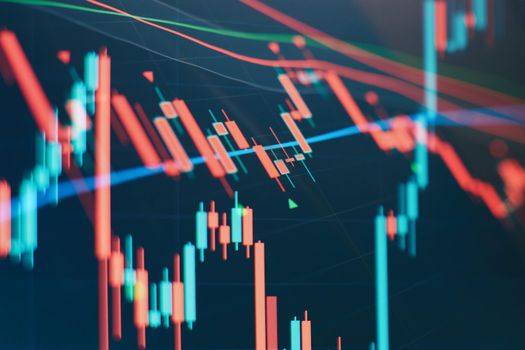
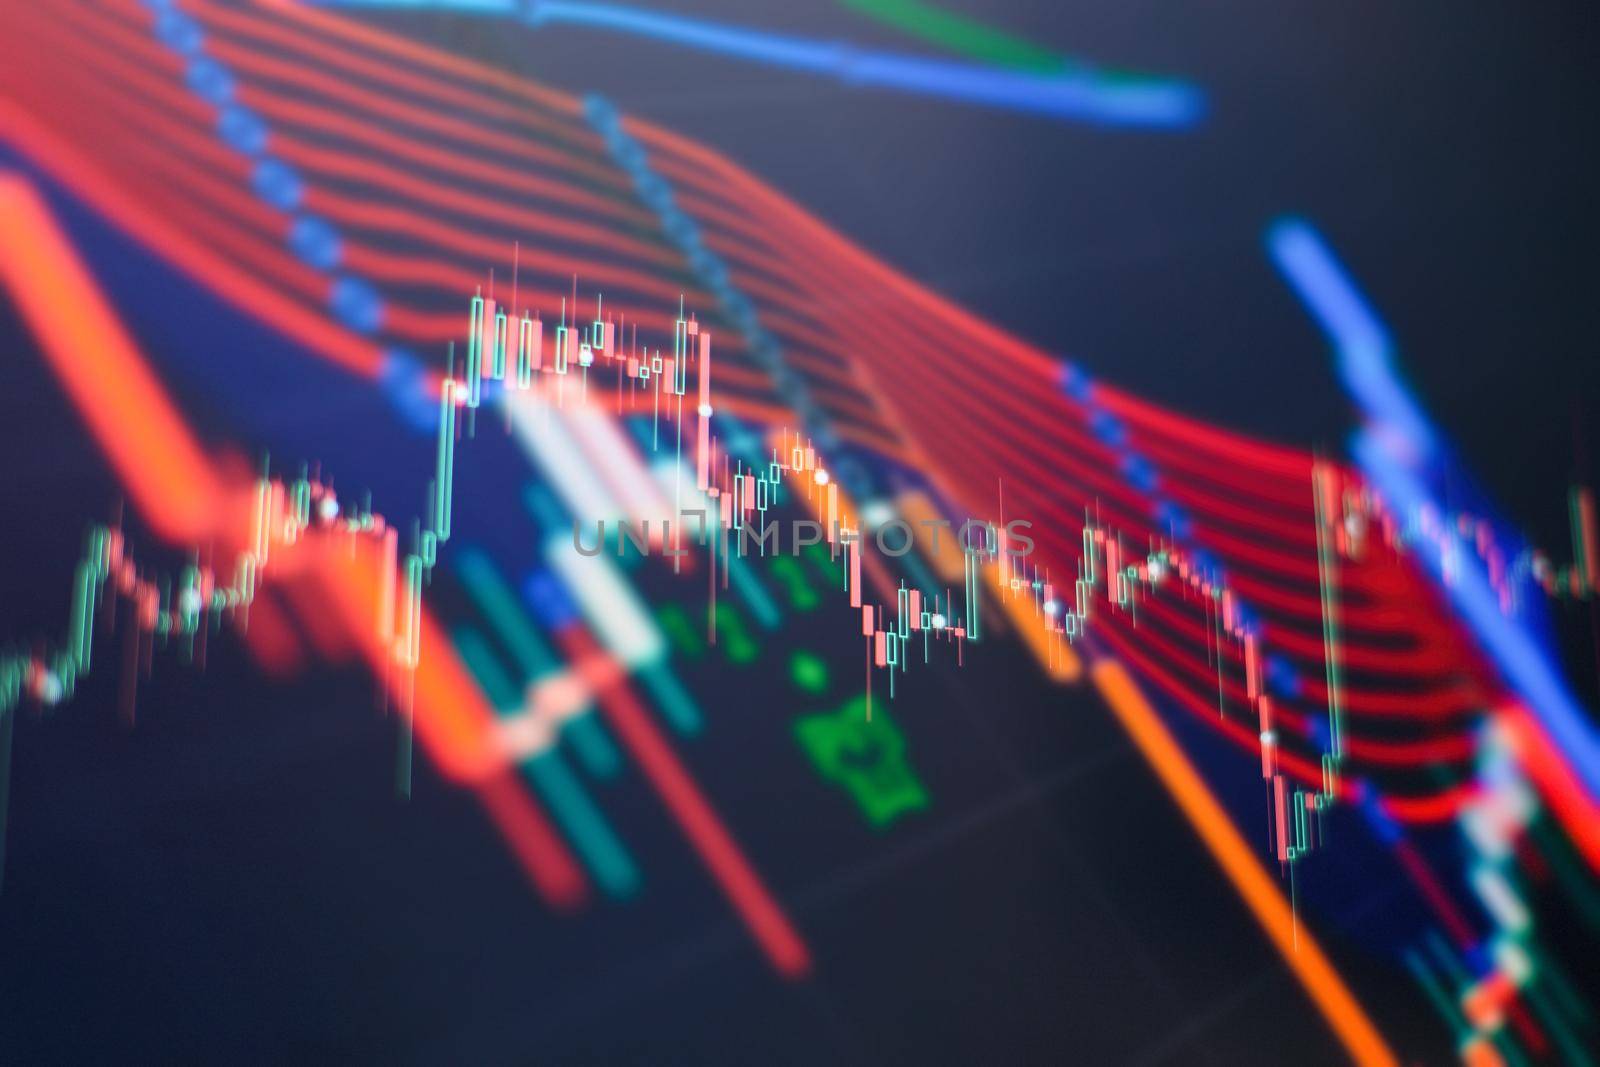
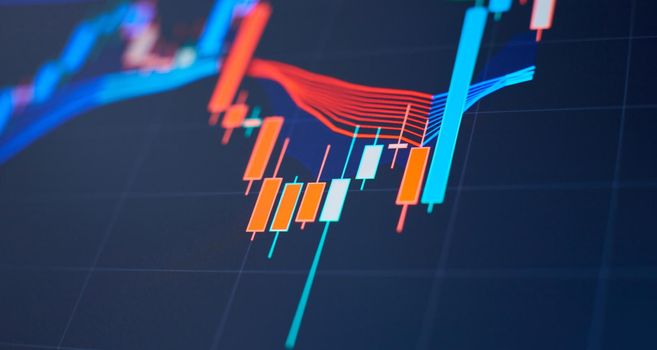
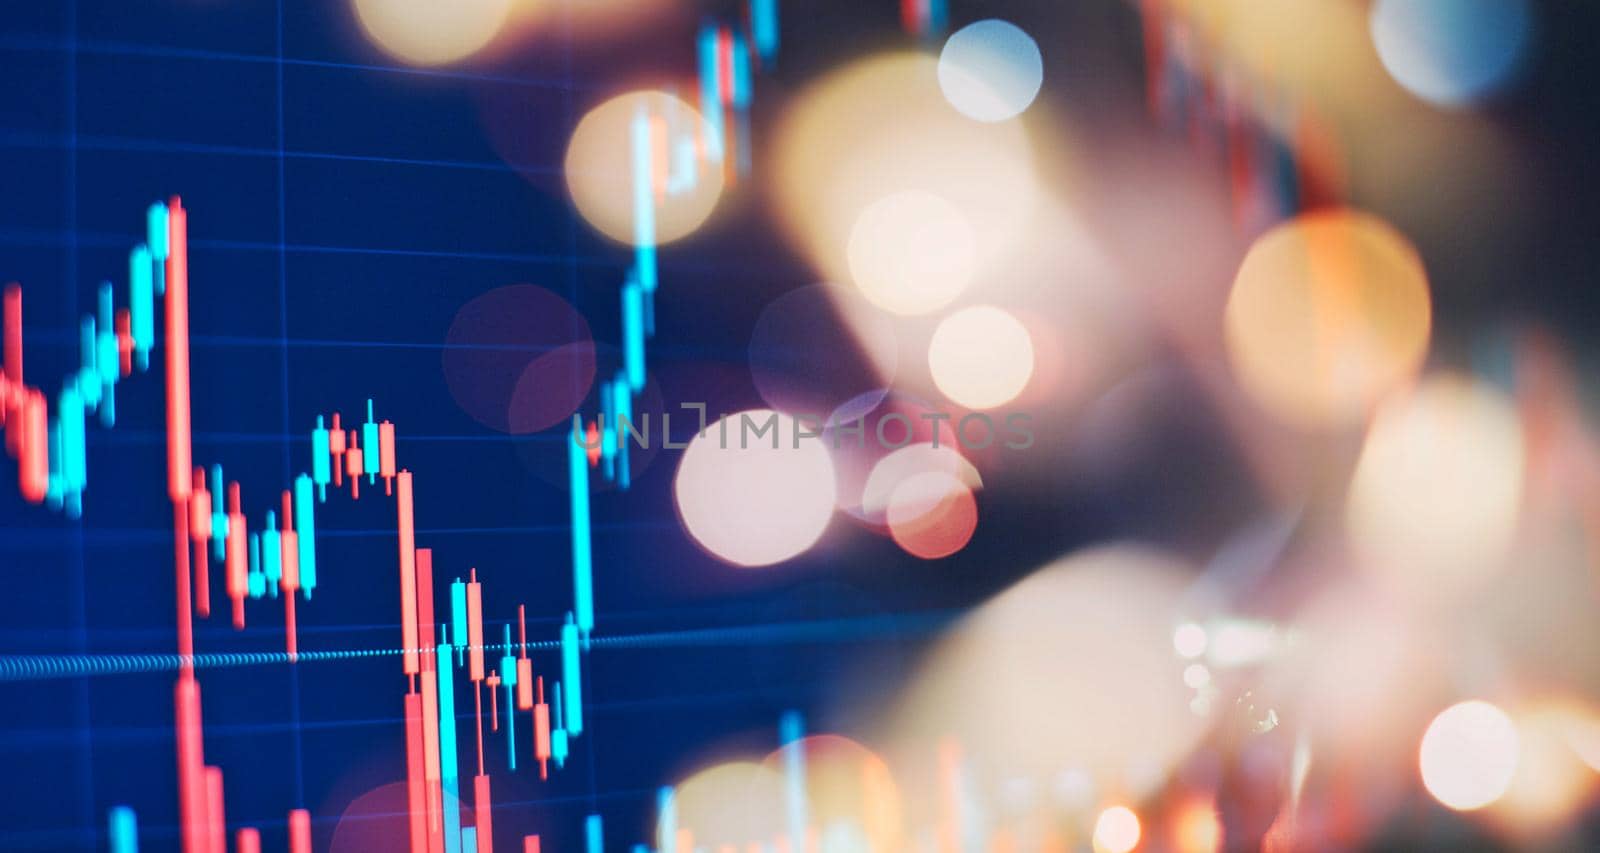
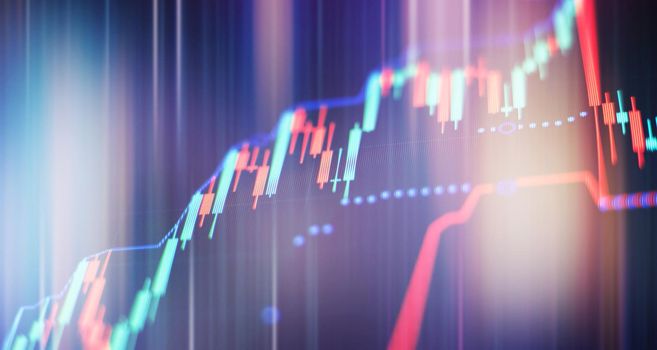
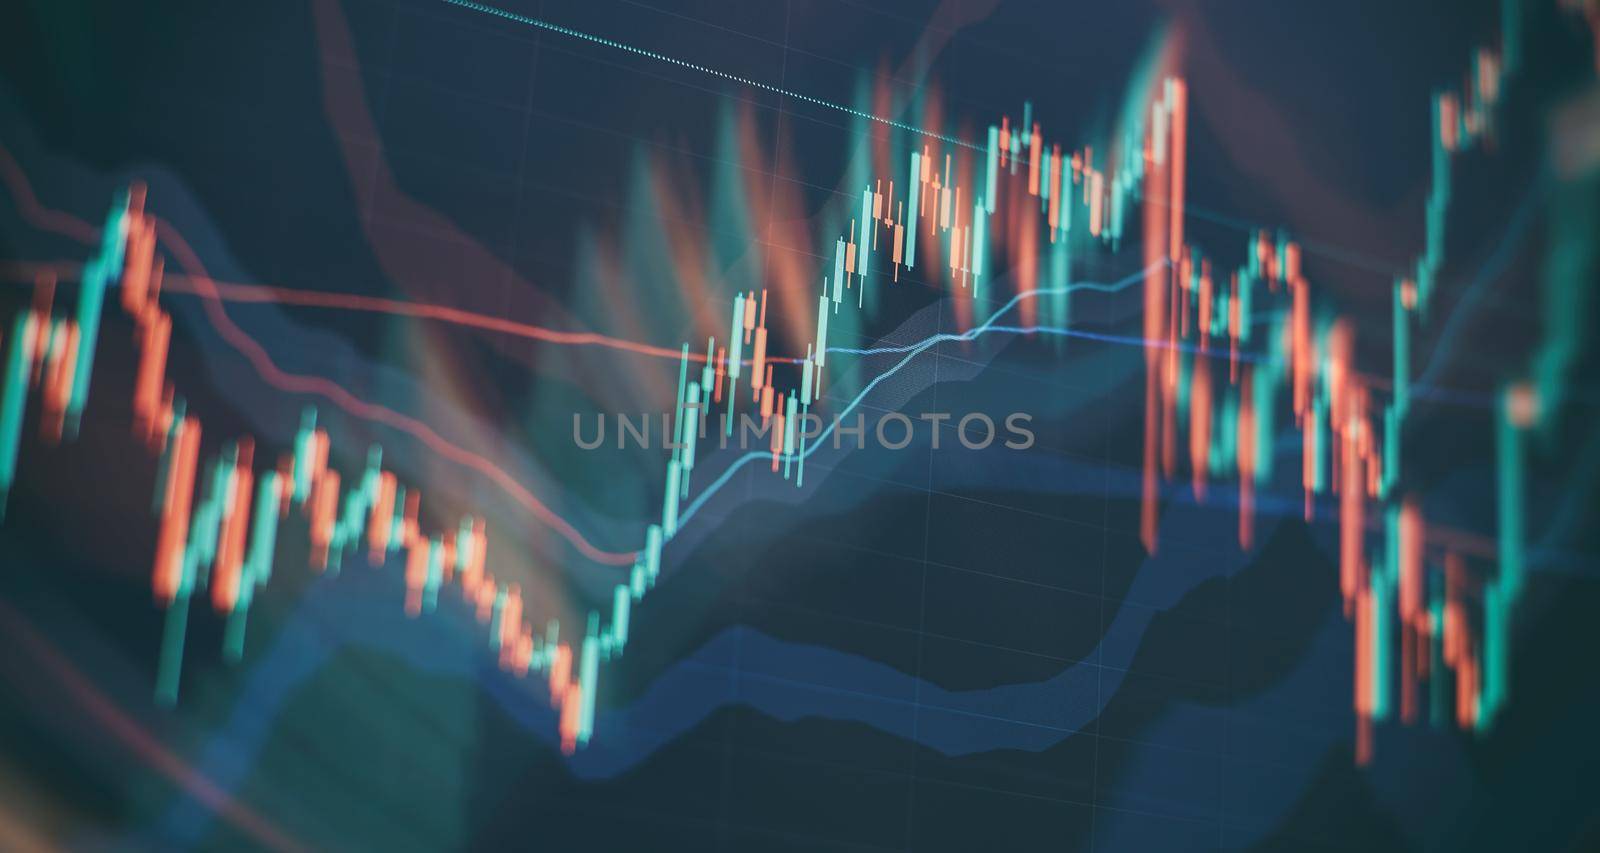
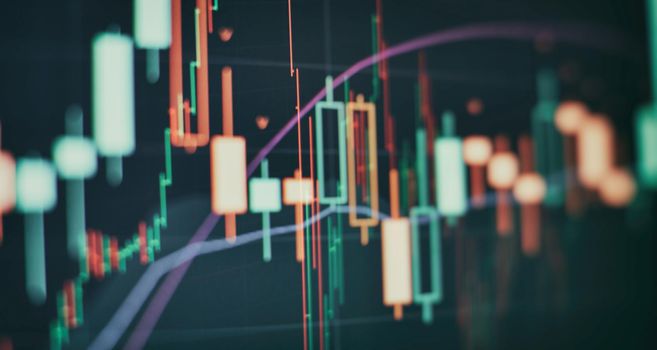
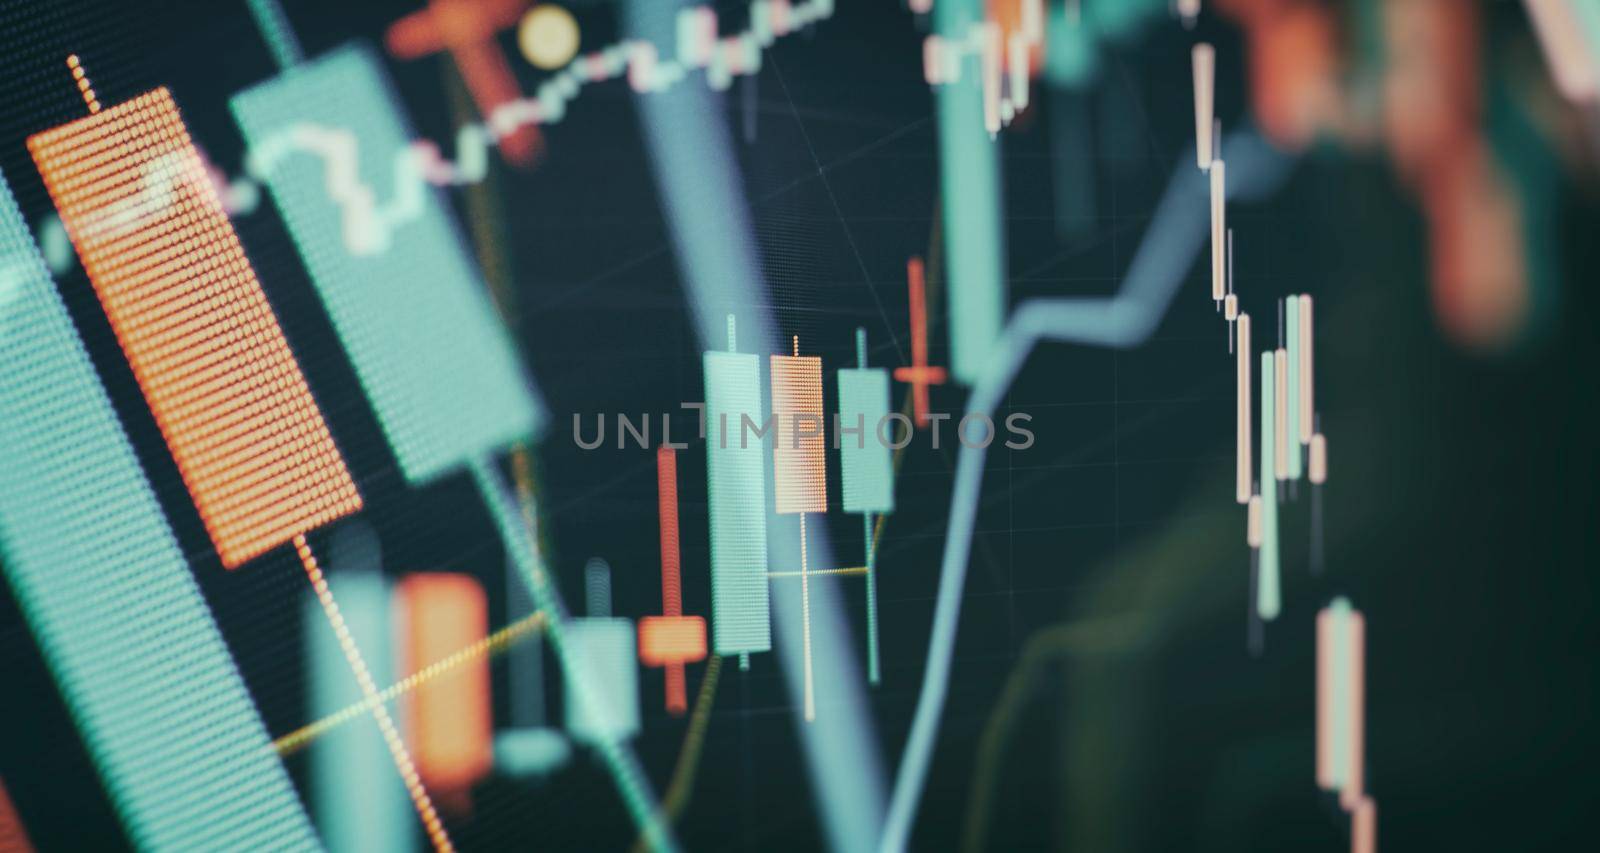
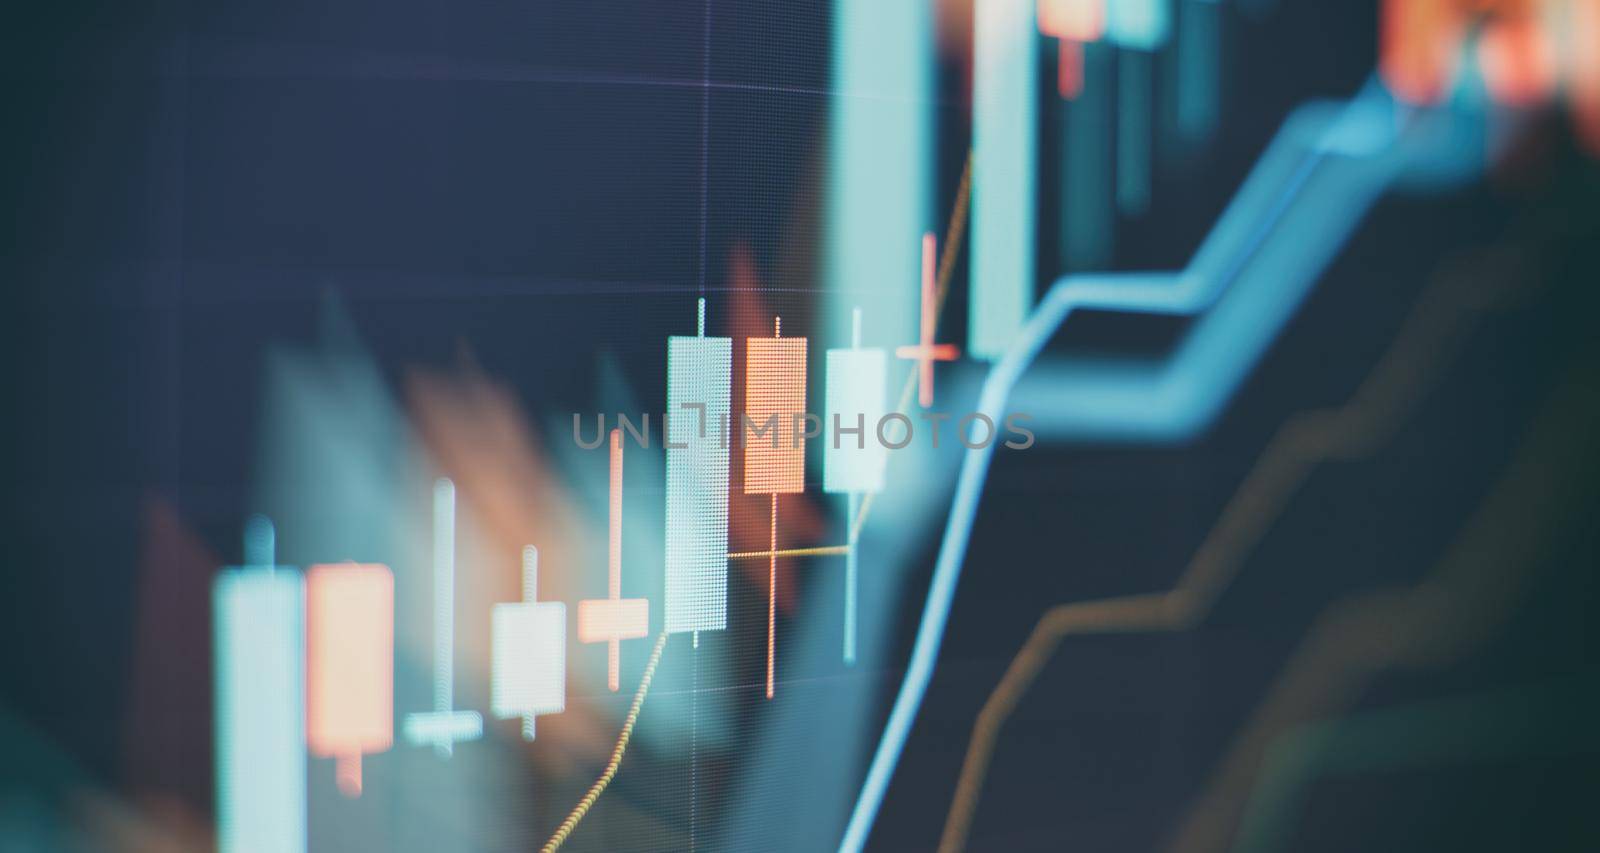
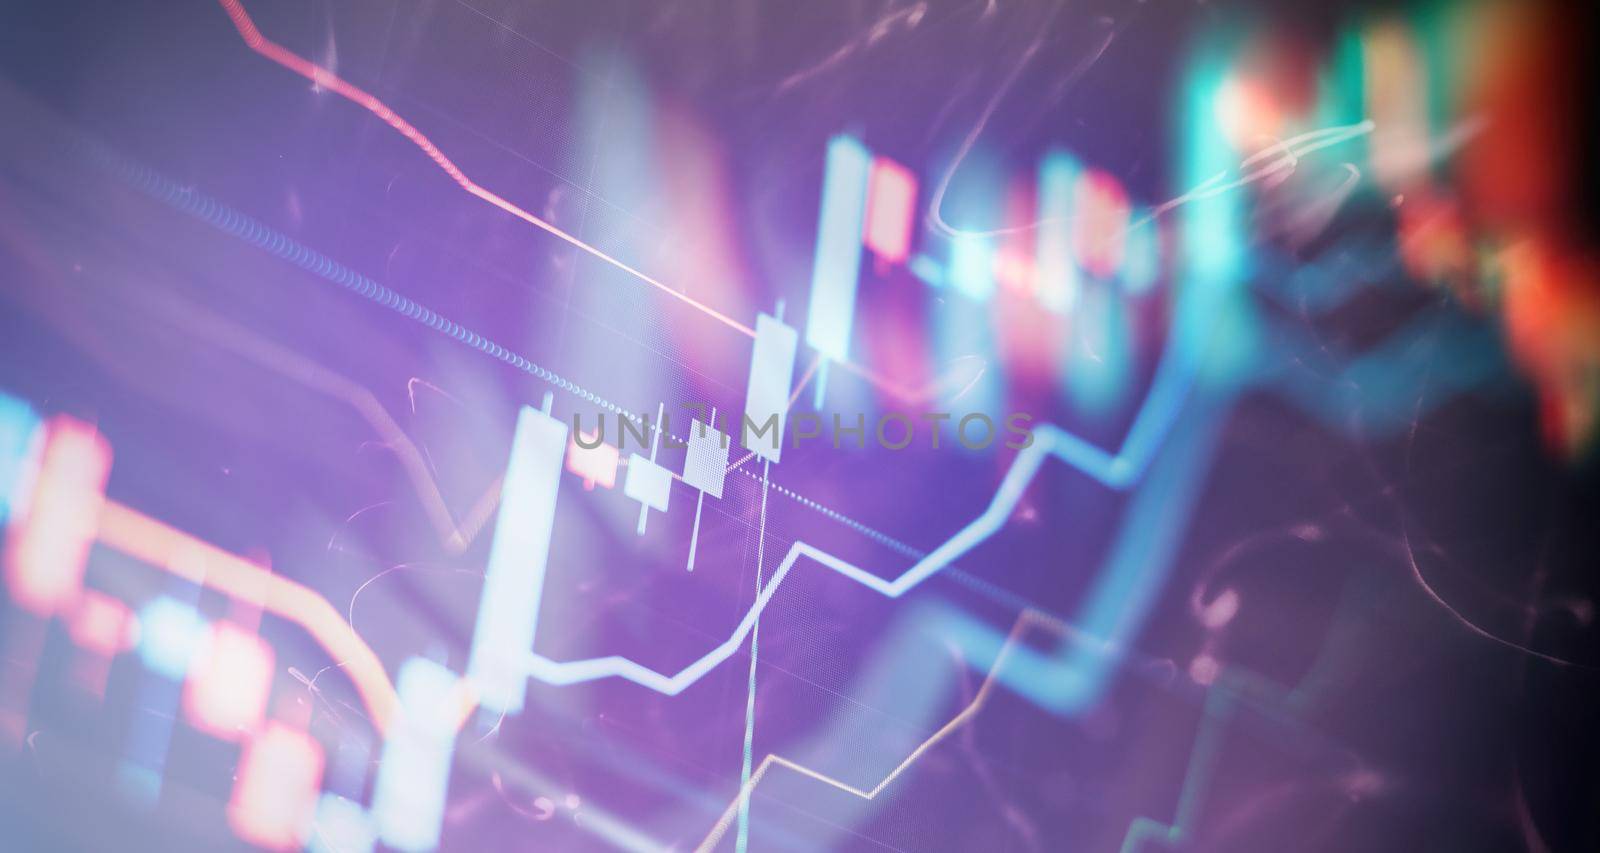
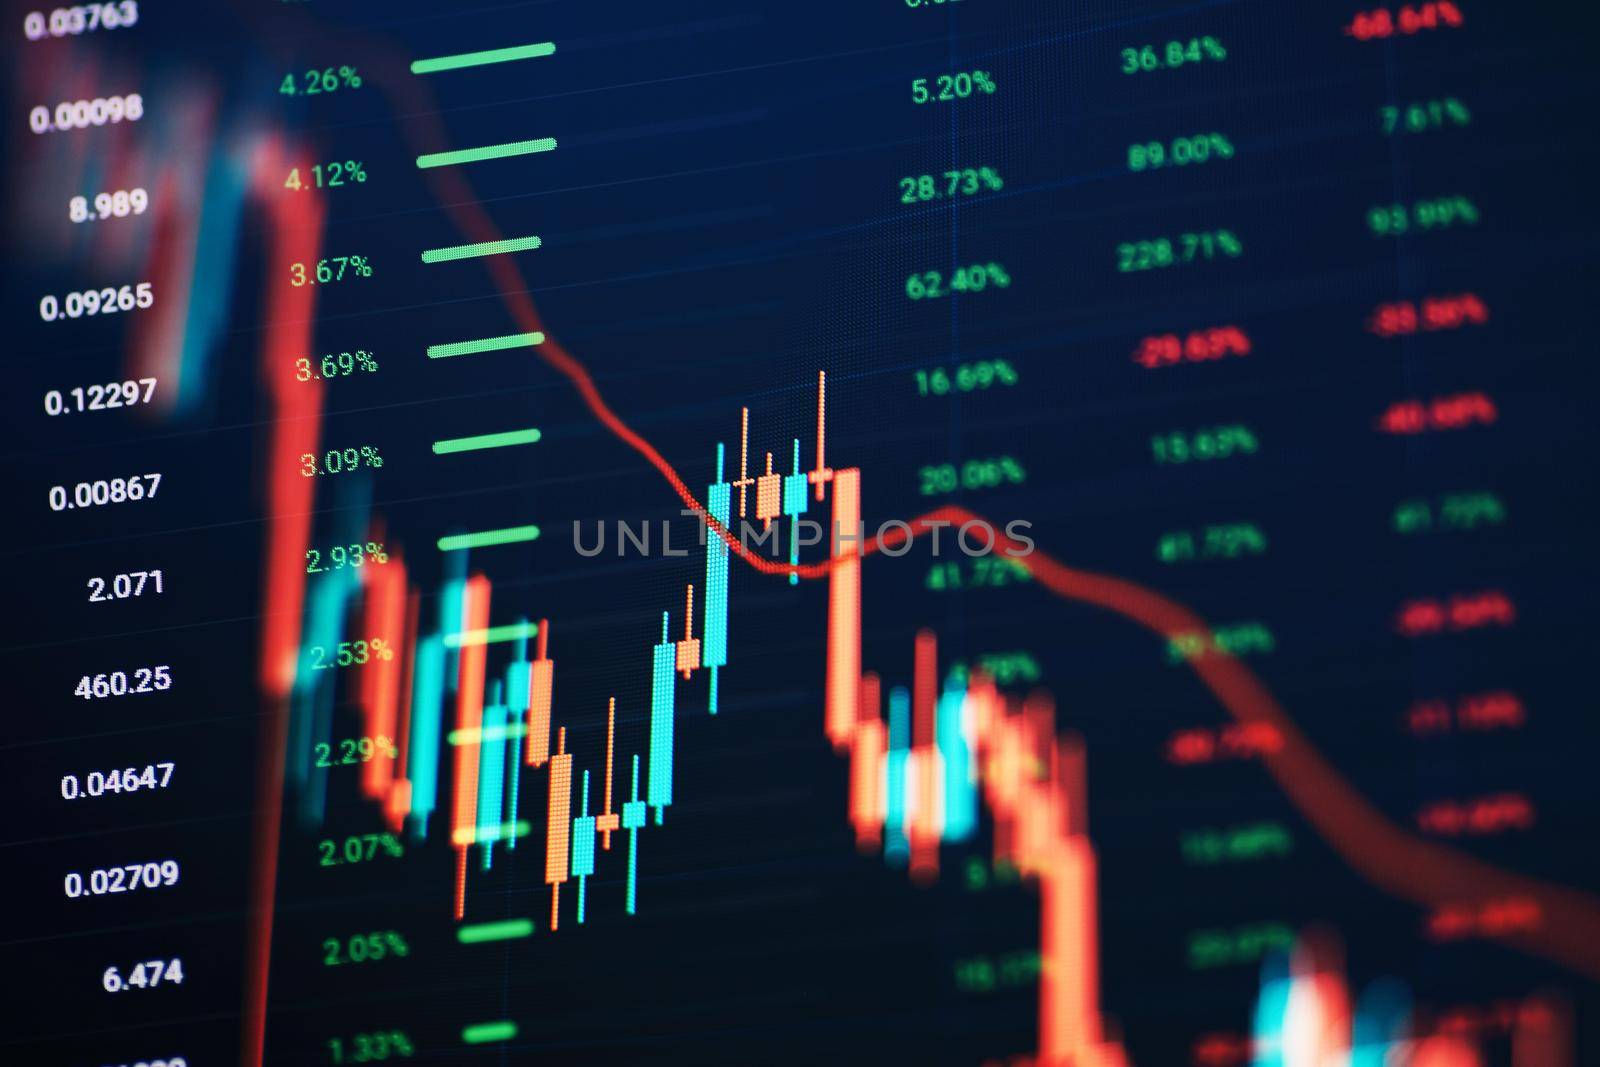
Market Analyze. Bar graphs, Diagrams, financial figures. Abstract glowing forex chart interface wallpaper. Investment, trade, stock, finance
Stock PhotoUsername
MaximusndResolution
8858x4724pxMarket Analyze. Bar graphs, Diagrams, financial figures. Abstract glowing forex chart interface wallpaper. Investment, trade, stock, finance
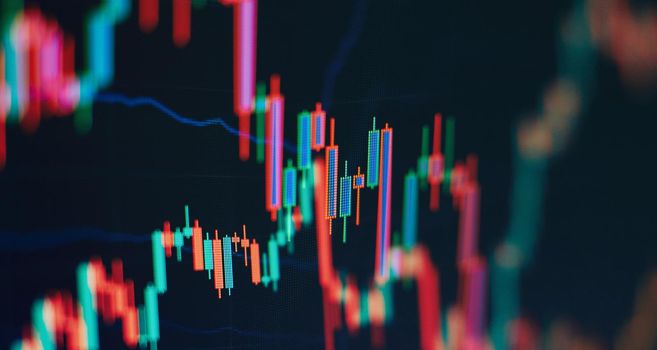
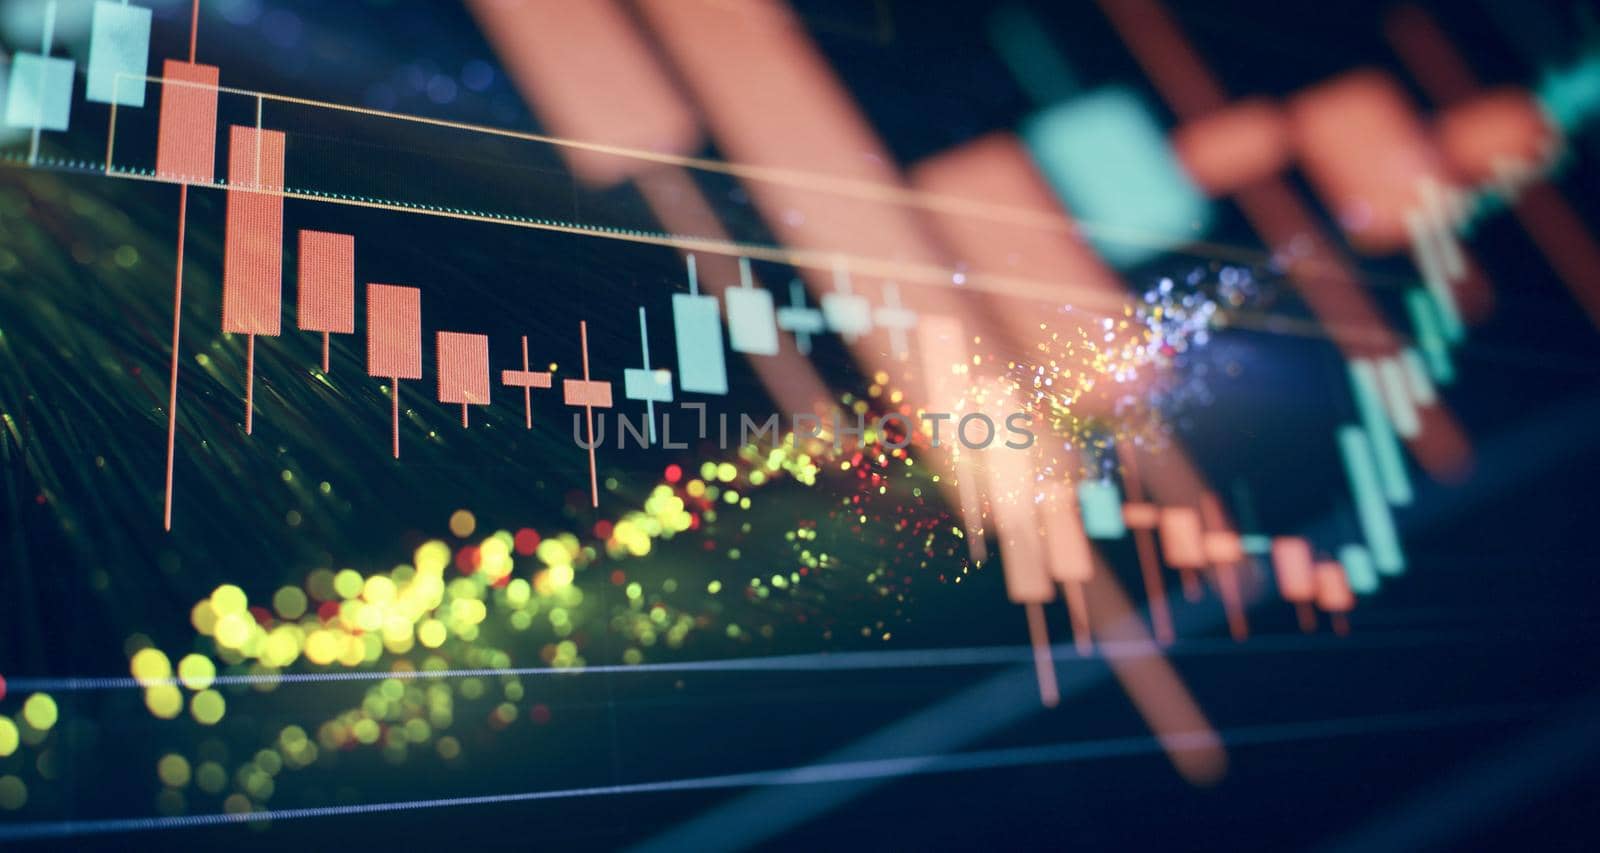
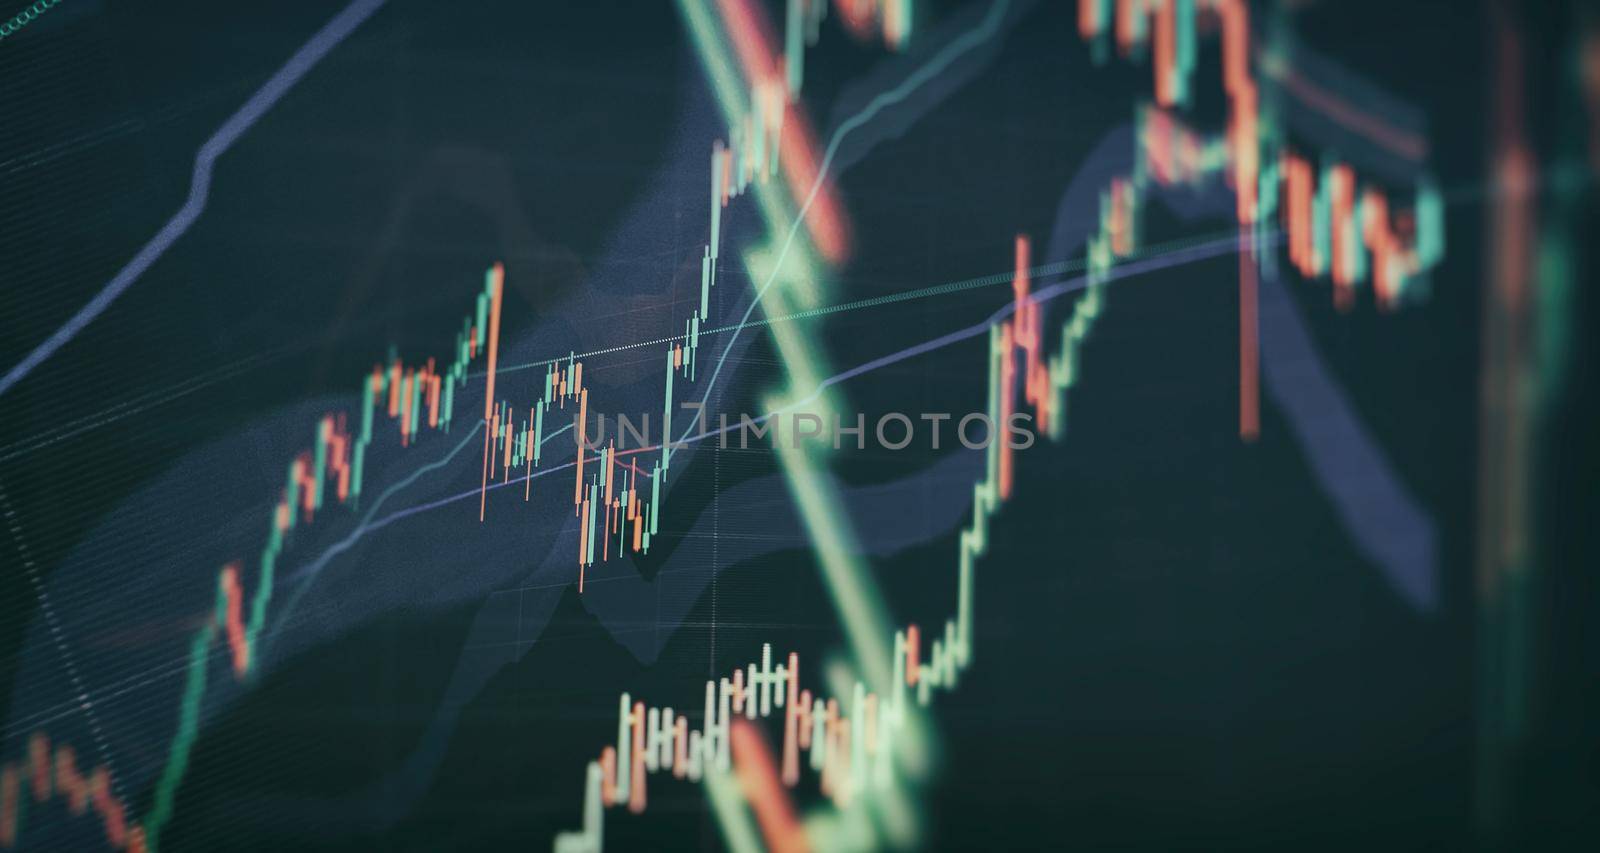
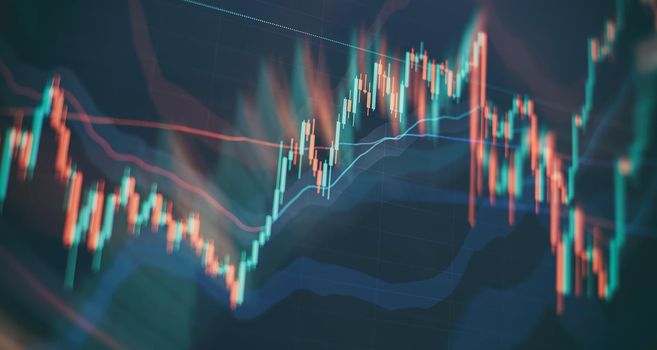
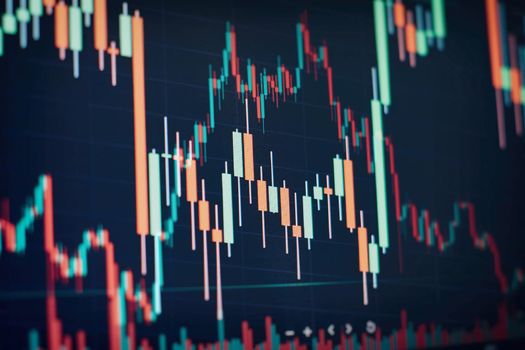
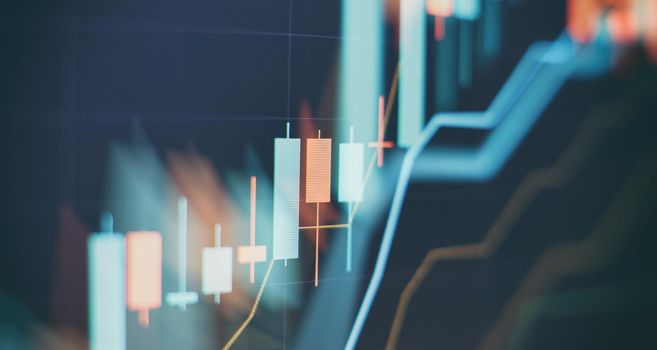
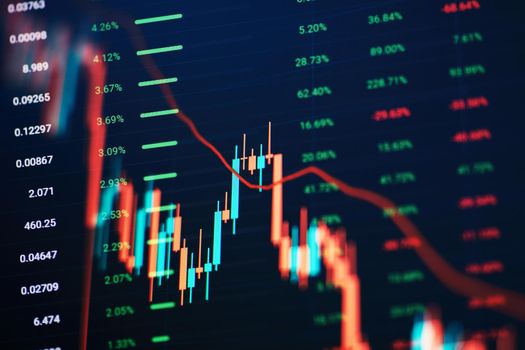
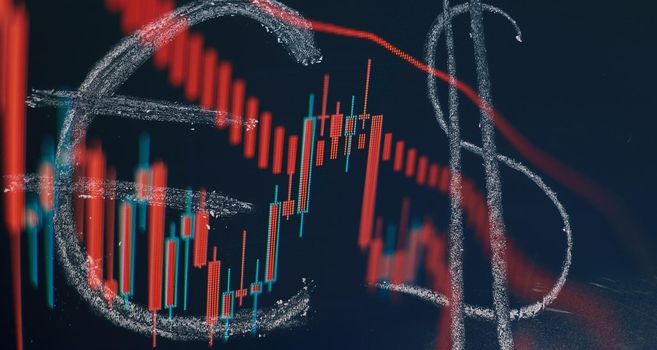
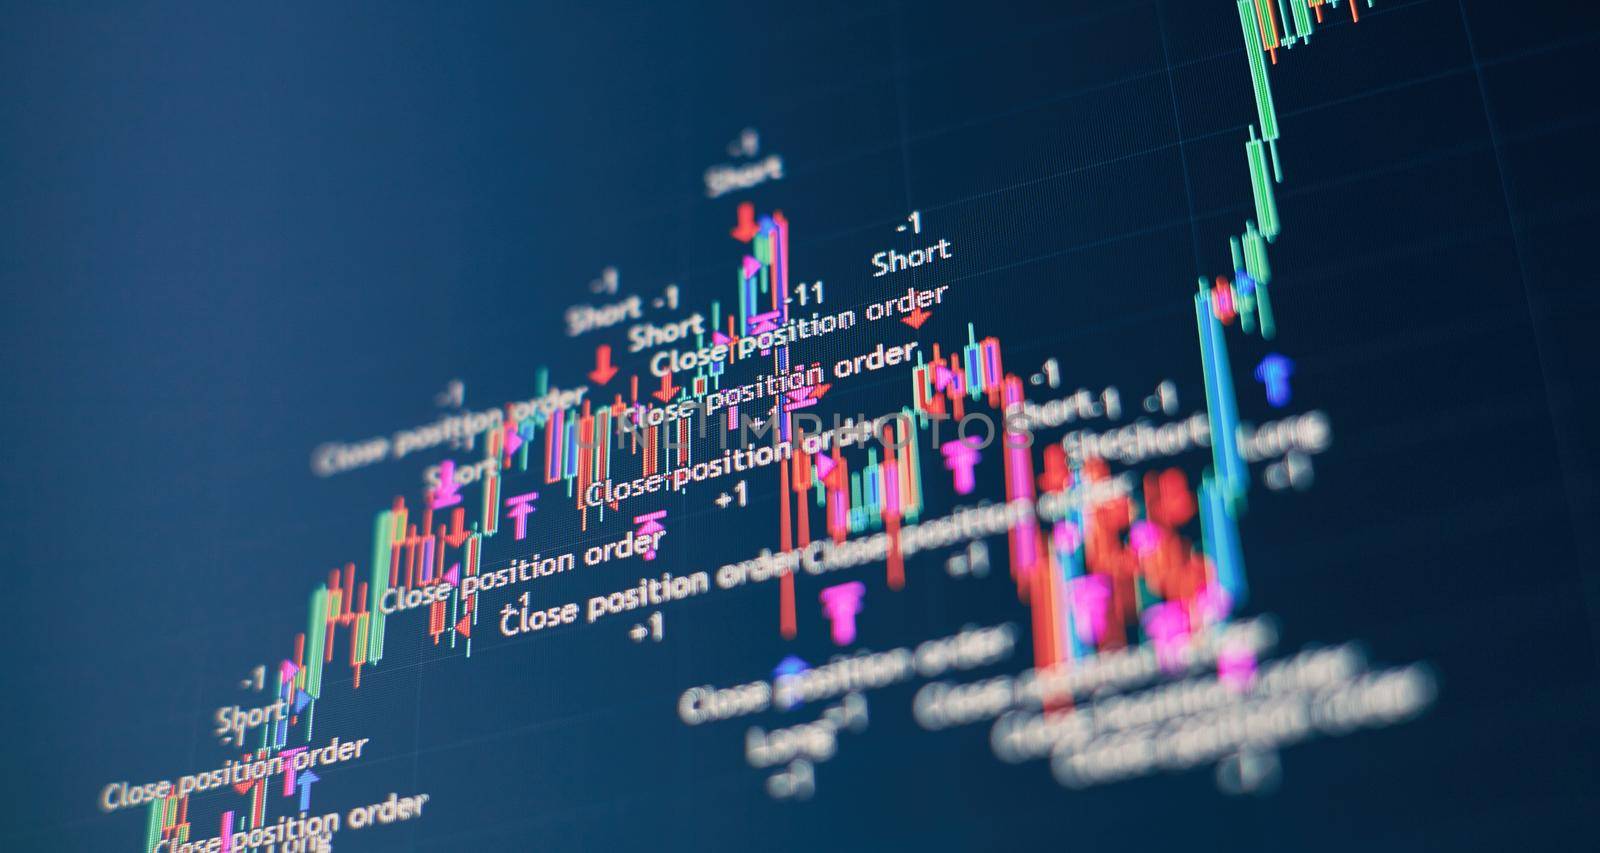
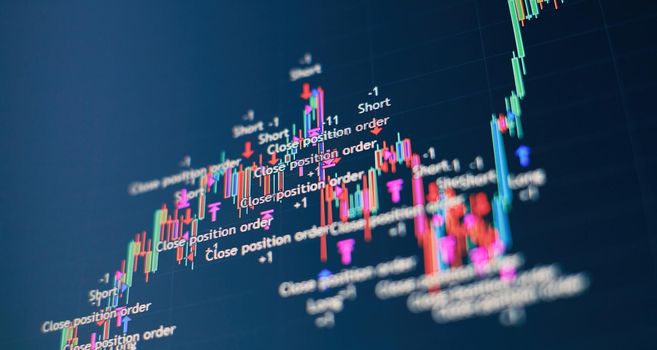
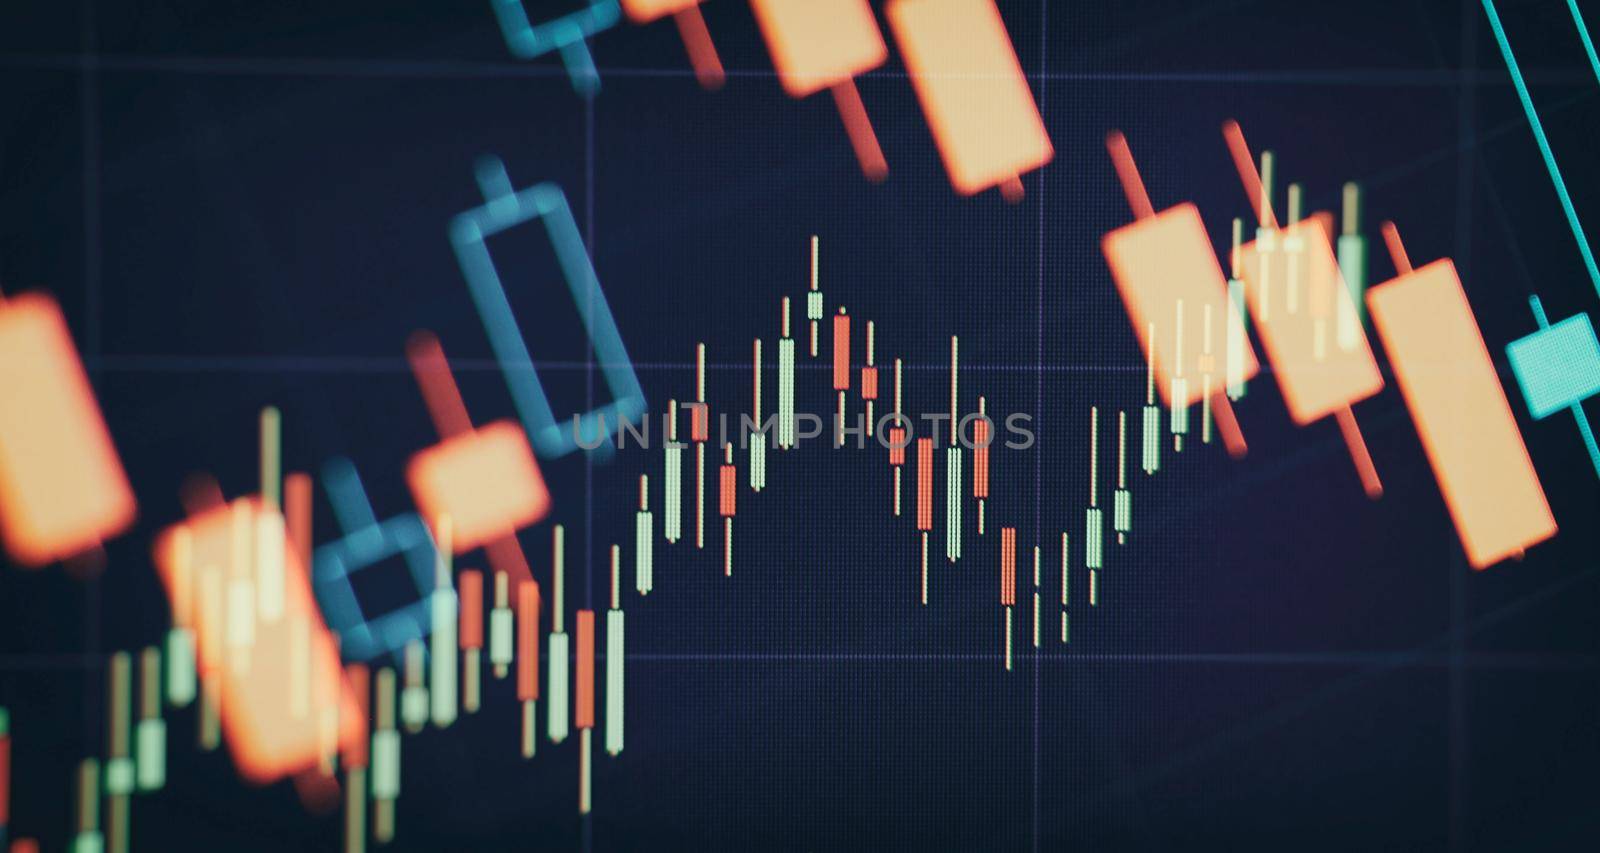
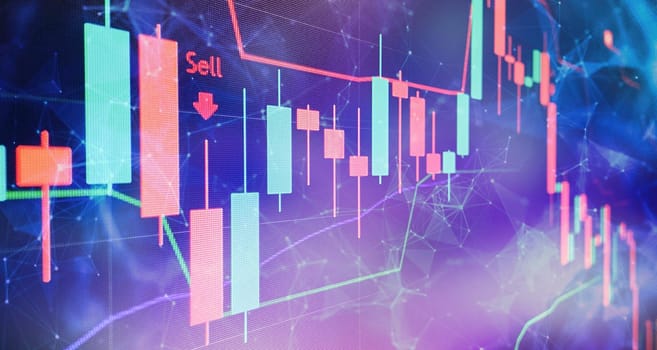
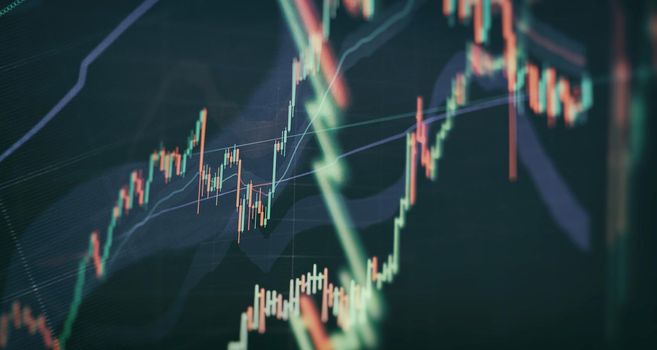
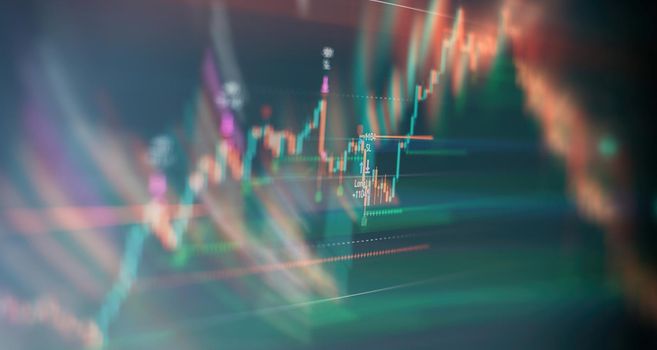
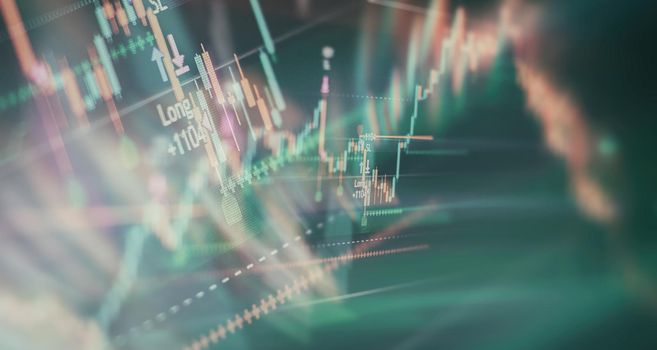
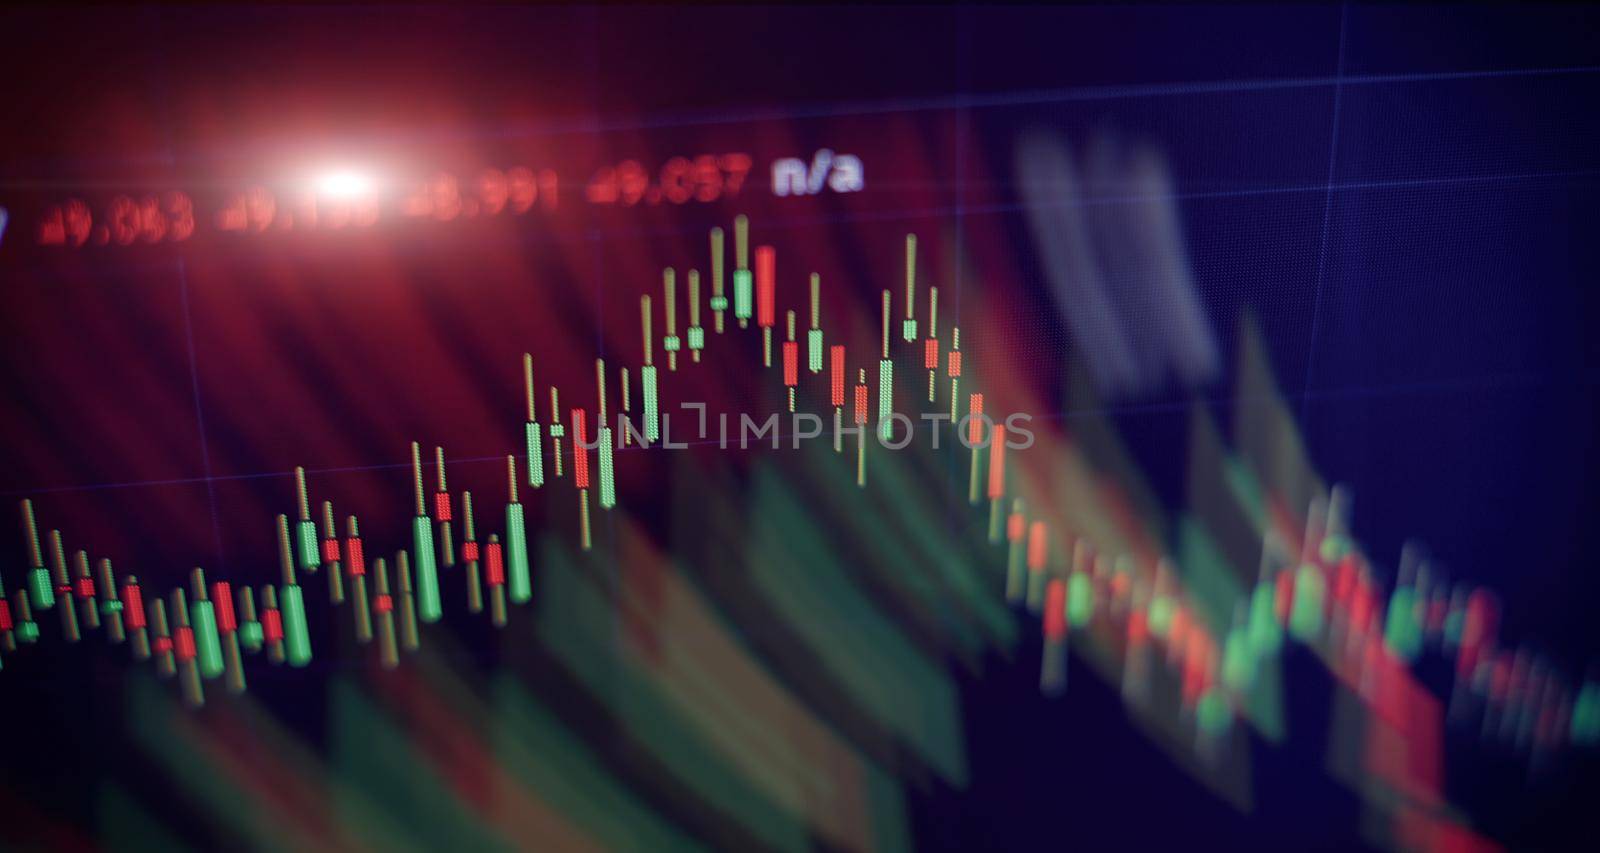
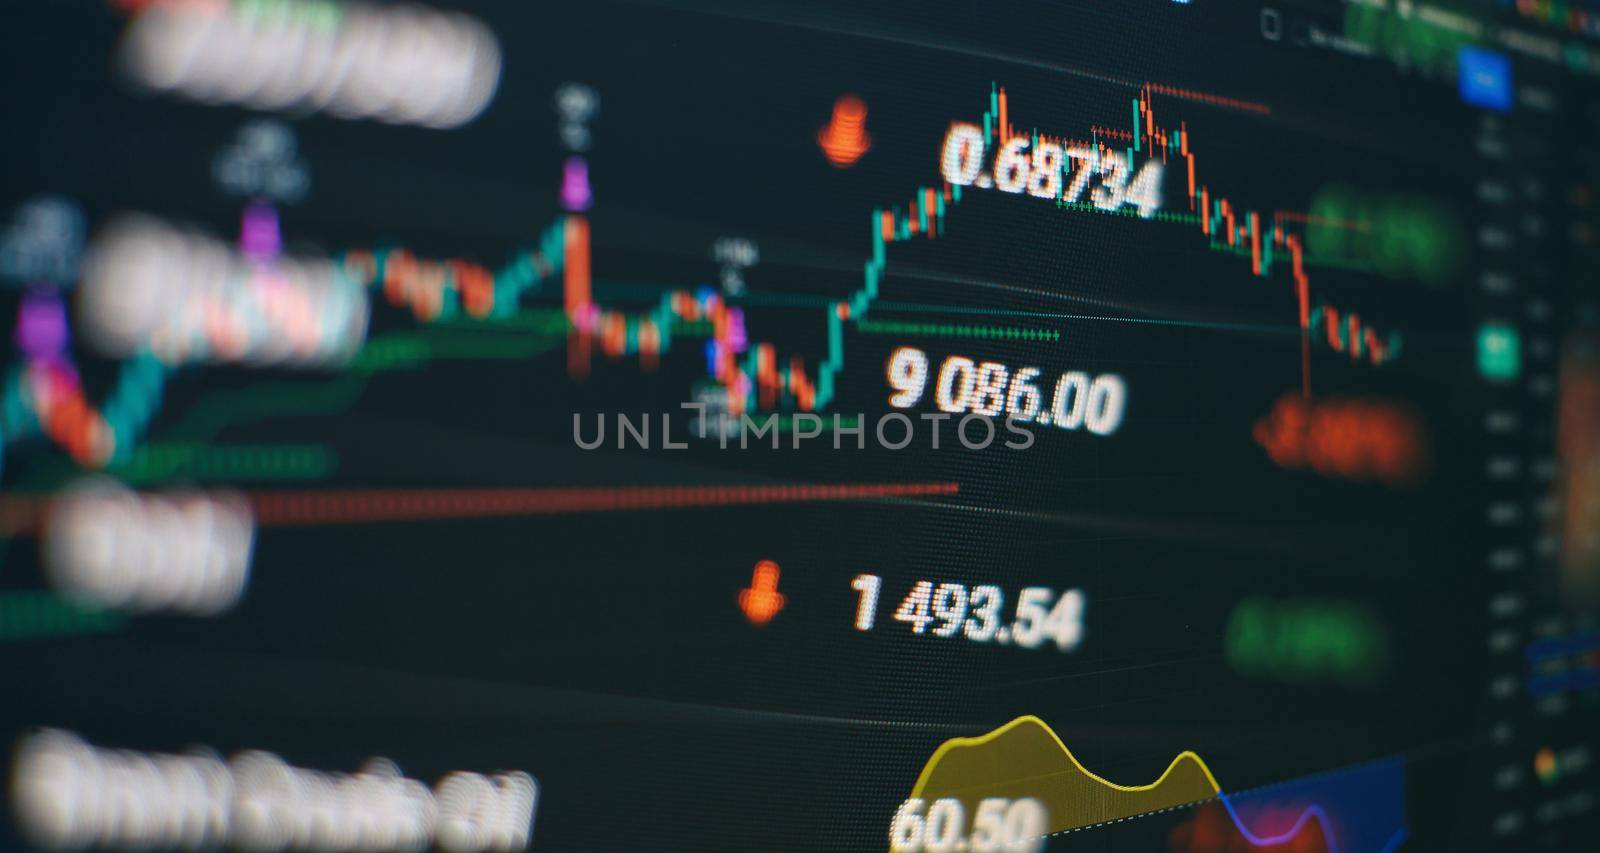
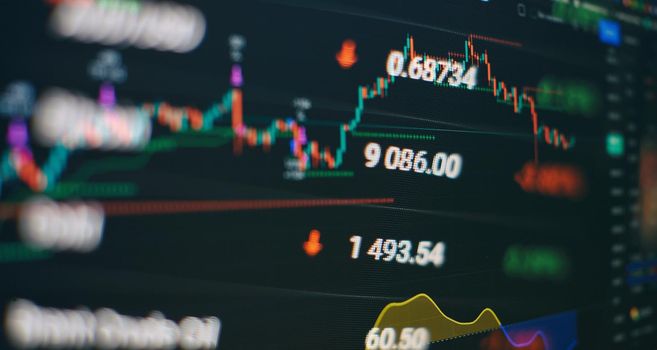
Stock market investment trading. The Forex graph chart on the digital screen.
Stock PhotoUsername
MaximusndResolution
8858x4724pxStock market investment trading. The Forex graph chart on the digital screen.


Monitor closeup of function source code. Abstract IT technology background. Software source code.
Stock PhotoUsername
MaximusndResolution
8858x4724pxMonitor closeup of function source code. Abstract IT technology background. Software source code.


Data on a monitor which including of Market Analyze. Bar graphs, Diagrams, financial figures.
Stock PhotoUsername
MaximusndResolution
8858x4724pxData on a monitor which including of Market Analyze. Bar graphs, Diagrams, financial figures.

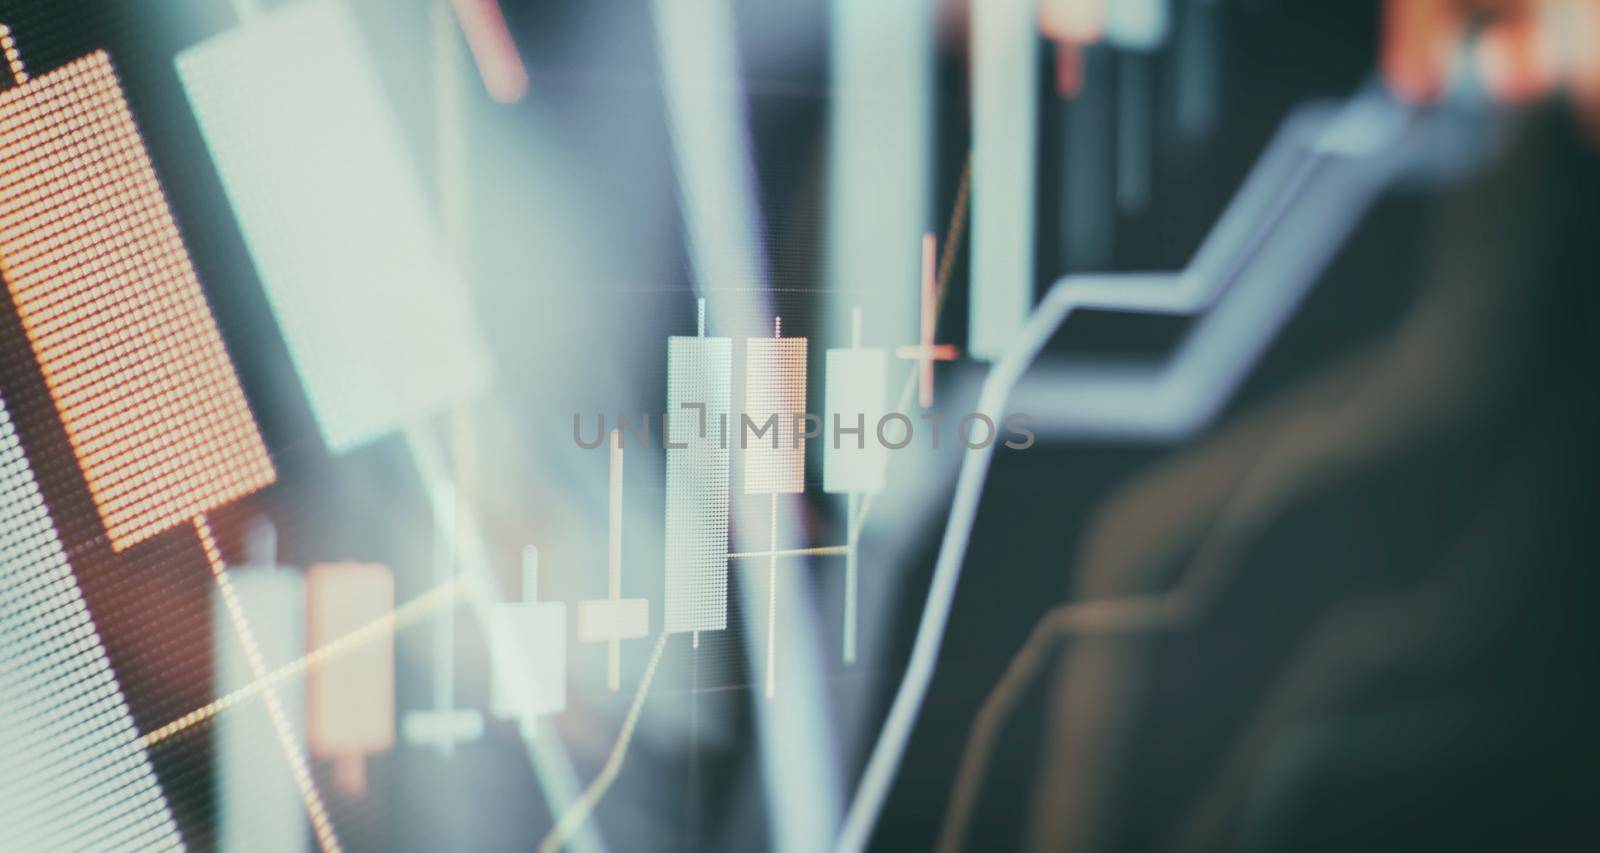
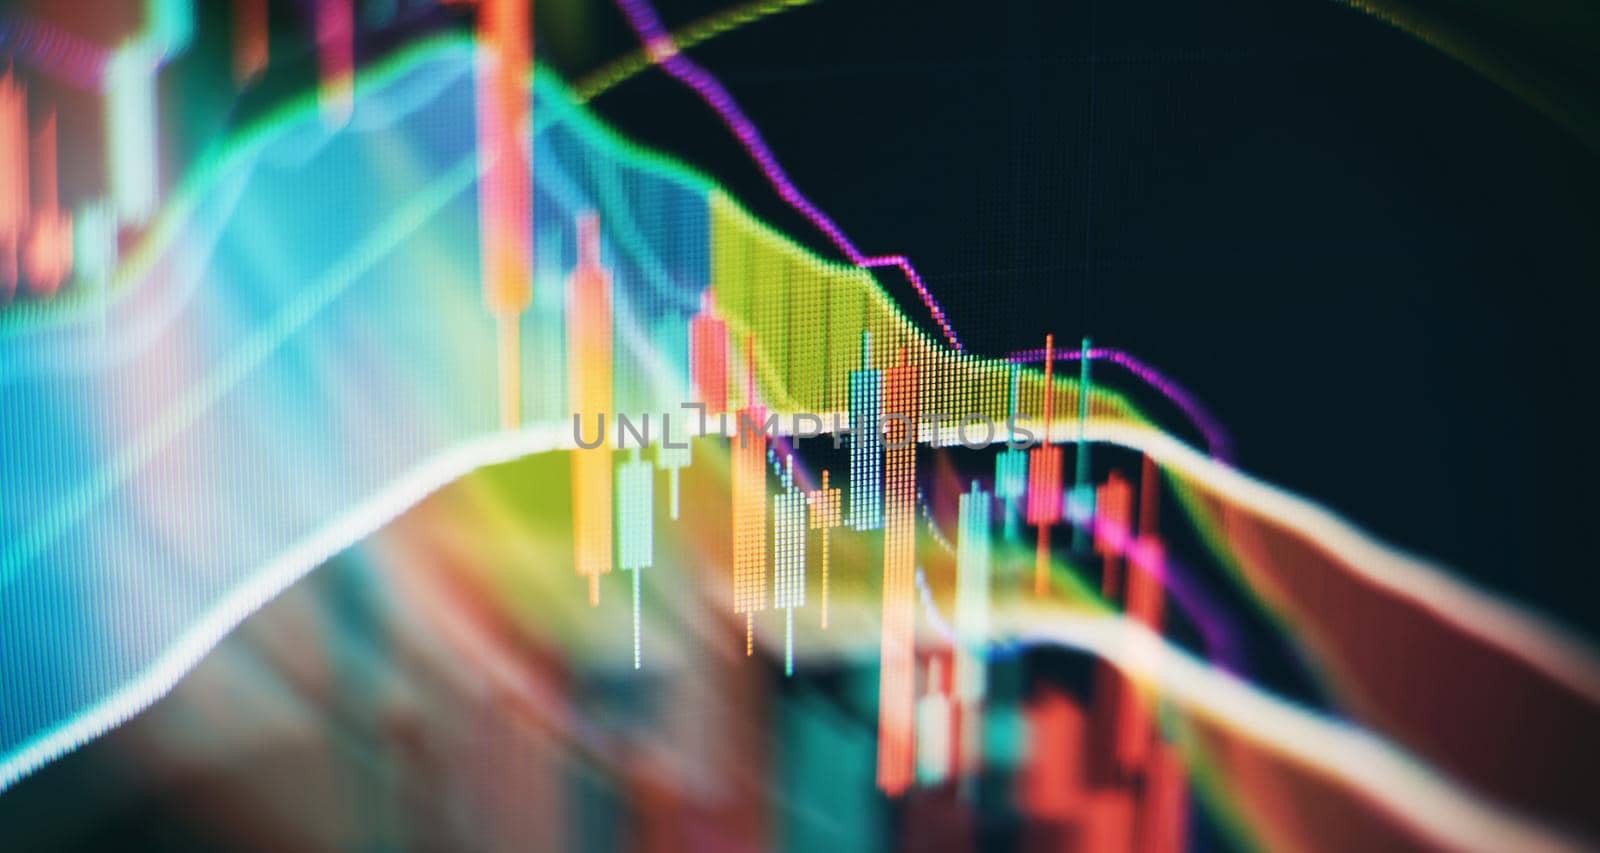
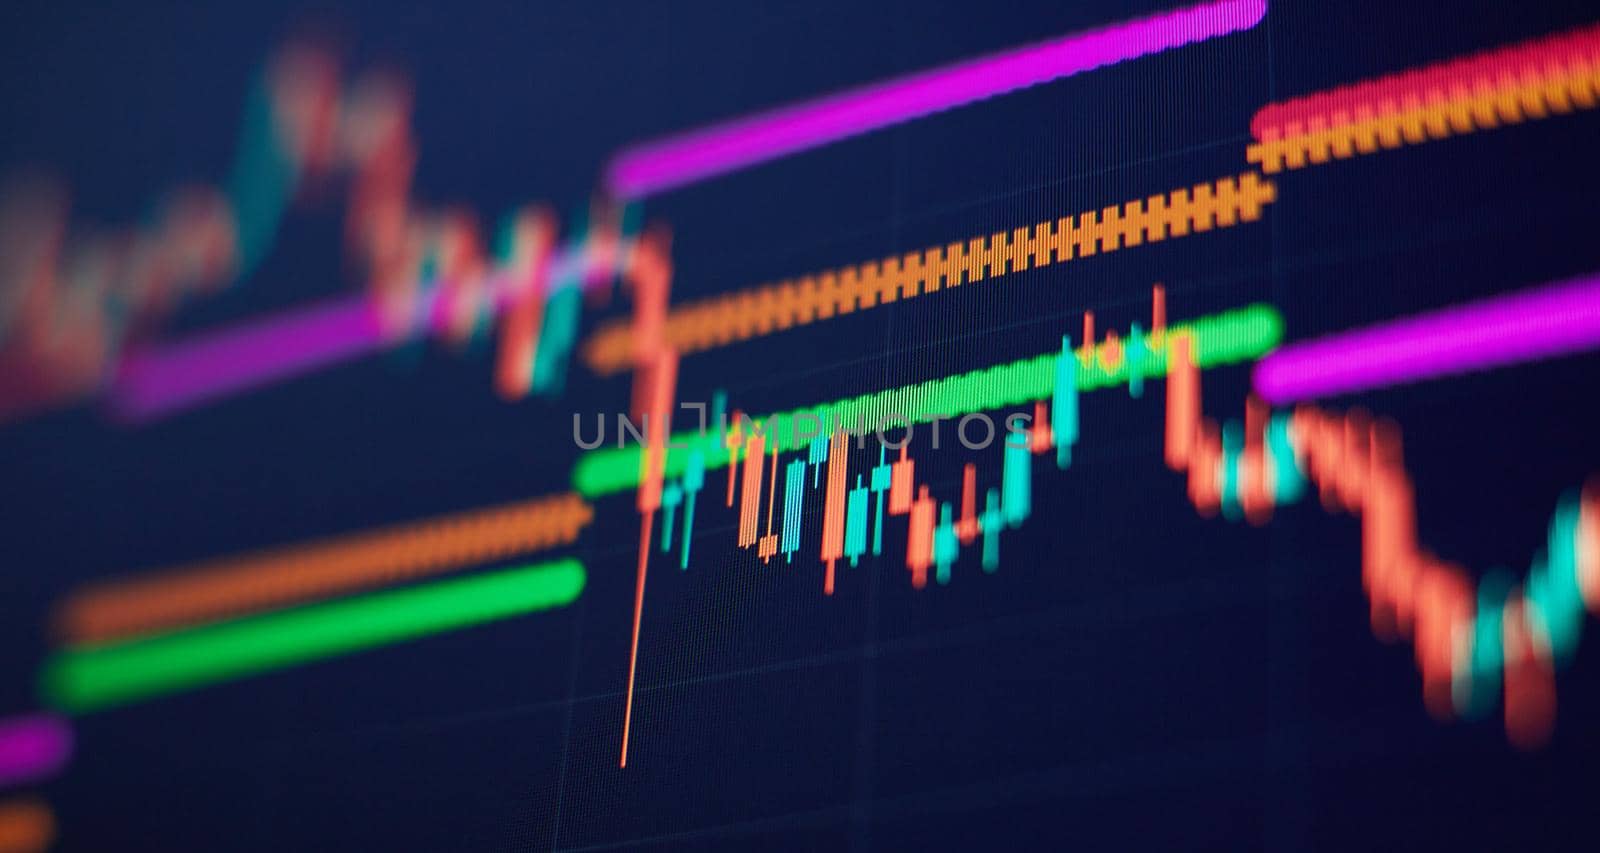
Abstract finance background. Stock market graph on led screen. Finance and investment concept.
Stock PhotoUsername
MaximusndResolution
8858x4724pxAbstract finance background. Stock market graph on led screen. Finance and investment concept.

Software developer programming code. Abstract computer script coding. Programming code screen of software developer.
Stock PhotoUsername
MaximusndResolution
8858x4724pxSoftware developer programming code. Abstract computer script coding. Programming code screen of software developer.


SEO optimization. Modern tech. PHP syntax highlighted. Writing programming functions on laptop. Big data and Internet of things trend.
Stock PhotoUsername
MaximusndResolution
8858x4724pxSEO optimization. Modern tech. PHP syntax highlighted. Writing programming functions on laptop. Big data and Internet of things trend.


SEO optimization. Modern tech. PHP syntax highlighted. Writing programming functions on laptop. Big data and Internet of things trend.
Stock PhotoUsername
MaximusndResolution
5315x3543pxSEO optimization. Modern tech. PHP syntax highlighted. Writing programming functions on laptop. Big data and Internet of things trend.

Stock market business graph chart on digital screen.Forex market, Gold market and Crude oil market .
Stock PhotoUsername
MaximusndResolution
5472x3648pxStock market business graph chart on digital screen.Forex market, Gold market and Crude oil market .
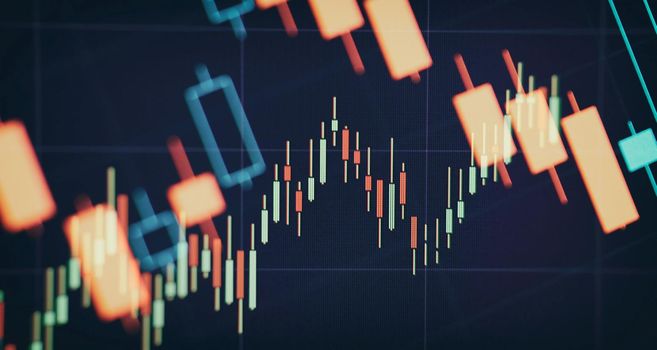
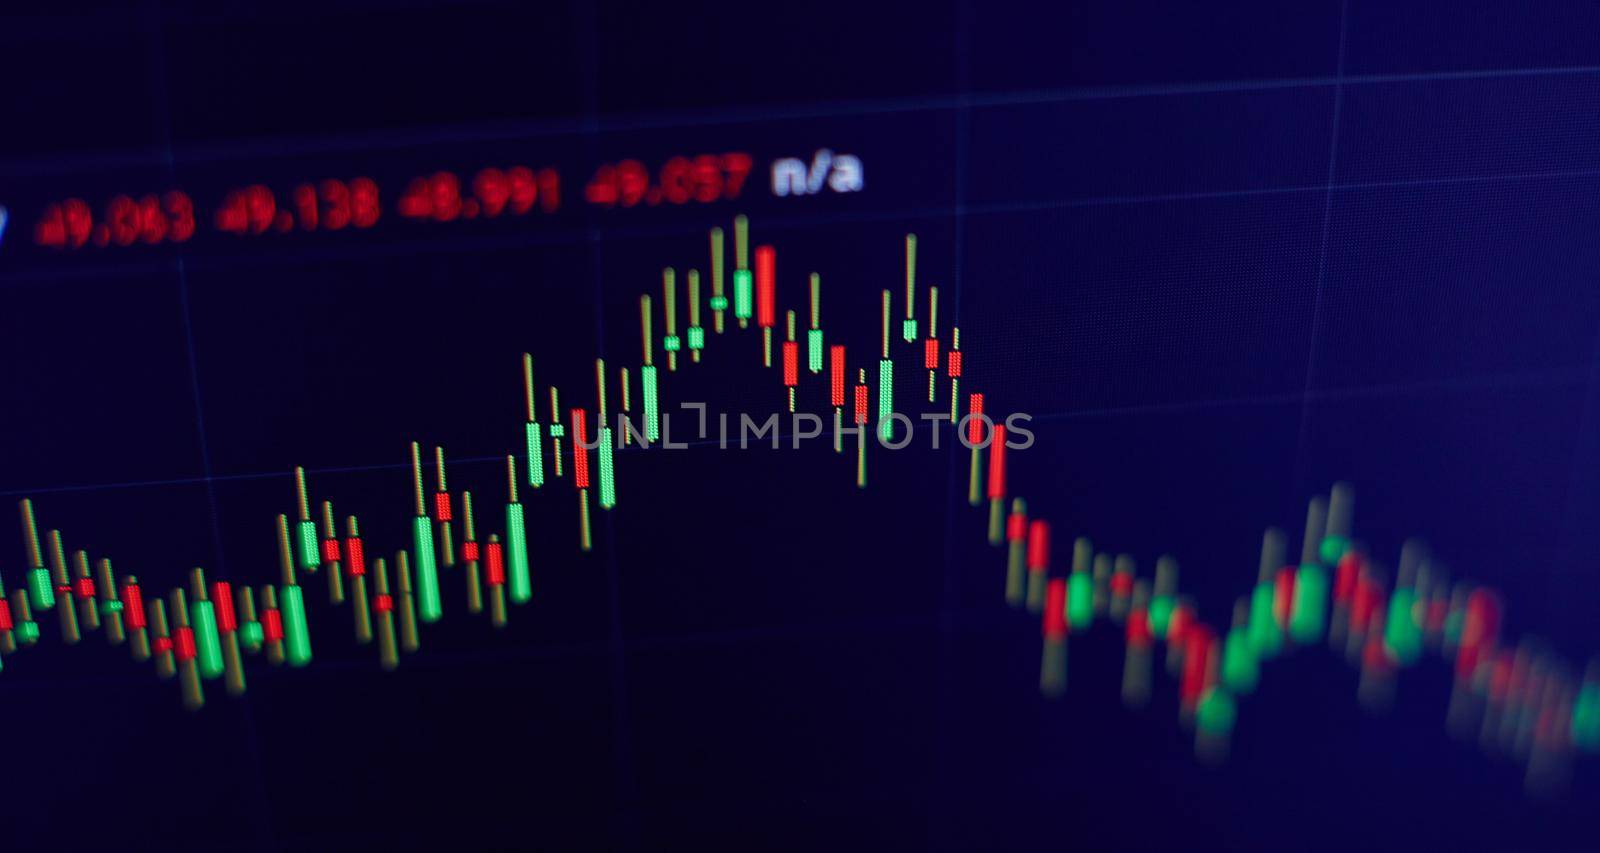
Financial diagram with candlestick chart used in market analysis for variation report of share price
Stock PhotoUsername
MaximusndResolution
8858x4724pxFinancial diagram with candlestick chart used in market analysis for variation report of share price
Economic trends business idea and all art work design. Abstract finance background
Stock PhotoUsername
MaximusndResolution
8858x4724pxEconomic trends business idea and all art work design. Abstract finance background

Businessman hand working on analyzing investment charts for Gold market, Forex market and Trading market.
Stock PhotoUsername
MaximusndResolution
5315x3543pxBusinessman hand working on analyzing investment charts for Gold market, Forex market and Trading market.

Business graph and stock financial indicator. Stock or business market analysis concept.
Stock PhotoUsername
MaximusndResolution
8858x4724pxBusiness graph and stock financial indicator. Stock or business market analysis concept.

Economic growth, recession. Electronic virtual platform showing trends and stock market fluctuations
Stock PhotoUsername
MaximusndResolution
8858x4724pxEconomic growth, recession. Electronic virtual platform showing trends and stock market fluctuations

Economy trends background for business idea and all art work design. Abstract finance background.
Stock PhotoUsername
MaximusndResolution
8858x4724pxEconomy trends background for business idea and all art work design. Abstract finance background.


Data on a monitor which including of Market Analyze. Bar graphs, Diagrams, financial figures.
Stock PhotoUsername
MaximusndResolution
8858x4724pxData on a monitor which including of Market Analyze. Bar graphs, Diagrams, financial figures.
The business plan at the meeting and analyze financial numbers to view the performance of the company.
Stock PhotoUsername
MaximusndResolution
8858x4724pxThe business plan at the meeting and analyze financial numbers to view the performance of the company.


Analysis business accounting on info sheets. Businessman hand working on analyzing investment charts for Gold
Stock PhotoUsername
MaximusndResolution
8858x4724pxAnalysis business accounting on info sheets. Businessman hand working on analyzing investment charts for Gold
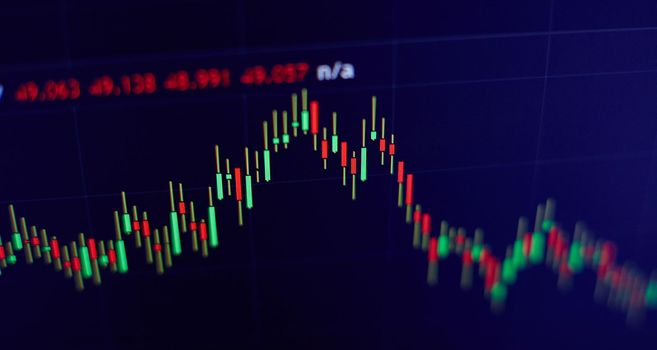
Financial diagram with candlestick chart used in market analysis for variation report of share price
Stock PhotoUsername
MaximusndResolution
8858x4724pxFinancial diagram with candlestick chart used in market analysis for variation report of share price
Stock market business graph chart on digital screen.Forex market, Gold market and Crude oil market .
Stock PhotoUsername
MaximusndResolution
8858x4724pxStock market business graph chart on digital screen.Forex market, Gold market and Crude oil market .

Charts of financial instruments with various type of indicators including volume analysis for professional technical analysis on the monitor of a computer.
Stock PhotoUsername
MaximusndResolution
8858x4724pxCharts of financial instruments with various type of indicators including volume analysis for professional technical analysis on the monitor of a computer.
The business plan at the meeting and analyze financial numbers to view the performance of the company.
Stock PhotoUsername
MaximusndResolution
8858x4724pxThe business plan at the meeting and analyze financial numbers to view the performance of the company.


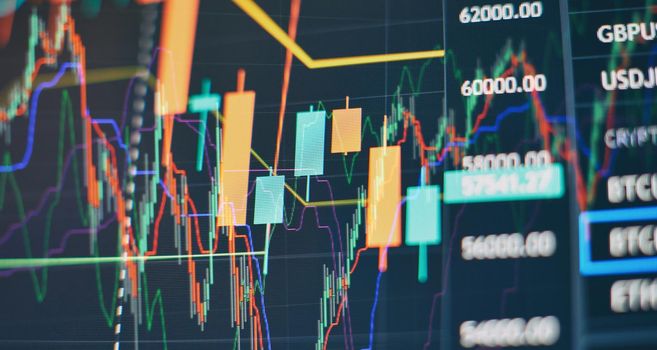
Bitcoin Stock Growth. Chart shows a strong increase in the price of bitcoin. Investing in virtual assets.
Stock PhotoUsername
MaximusndResolution
8192x6144pxBitcoin Stock Growth. Chart shows a strong increase in the price of bitcoin. Investing in virtual assets.

Business graph and stock financial indicator. Stock or business market analysis concept.
Stock PhotoUsername
MaximusndResolution
8858x4724pxBusiness graph and stock financial indicator. Stock or business market analysis concept.


Market Analyze. Bar graphs, Diagrams, financial figures. Abstract glowing forex chart interface wallpaper. Investment, trade, stock, finance
Stock PhotoUsername
MaximusndResolution
8858x4724pxMarket Analyze. Bar graphs, Diagrams, financial figures. Abstract glowing forex chart interface wallpaper. Investment, trade, stock, finance

Charts of financial instruments with various type of indicators including volume analysis for professional technical analysis on the monitor of a computer.
Stock PhotoUsername
MaximusndResolution
8858x4724pxCharts of financial instruments with various type of indicators including volume analysis for professional technical analysis on the monitor of a computer.
Abstract finance background. Stock market graph on led screen. Finance and investment concept.
Stock PhotoUsername
MaximusndResolution
8858x4724pxAbstract finance background. Stock market graph on led screen. Finance and investment concept.

Charts of financial instruments with various type of indicators including volume analysis for professional technical analysis on the monitor of a computer.
Stock PhotoUsername
MaximusndResolution
8858x4724pxCharts of financial instruments with various type of indicators including volume analysis for professional technical analysis on the monitor of a computer.
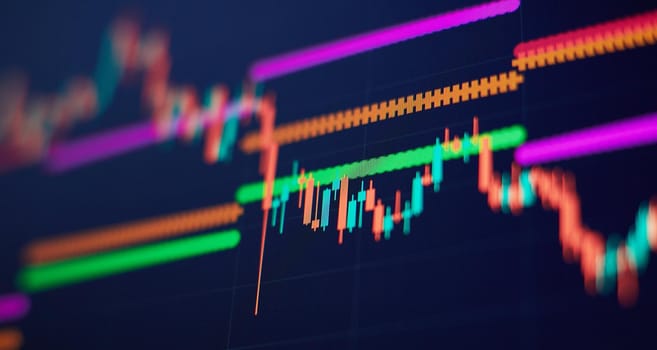
Abstract finance background. Stock market graph on led screen. Finance and investment concept.
Stock PhotoUsername
MaximusndResolution
8858x4724pxAbstract finance background. Stock market graph on led screen. Finance and investment concept.

Abstract finance background. Stock market graph on led screen. Finance and investment concept.
Stock PhotoUsername
MaximusndResolution
8858x4724pxAbstract finance background. Stock market graph on led screen. Finance and investment concept.
Stock market investment trading. The Forex graph chart on the digital screen.
Stock PhotoUsername
MaximusndResolution
8858x4724pxStock market investment trading. The Forex graph chart on the digital screen.


Economy trends background for business idea and all art work design. Abstract finance background.
Stock PhotoUsername
MaximusndResolution
8858x4724pxEconomy trends background for business idea and all art work design. Abstract finance background.

Charts of financial instruments with various type of indicators including volume analysis for professional technical analysis on the monitor of a computer.
Stock PhotoUsername
MaximusndResolution
5315x3543pxCharts of financial instruments with various type of indicators including volume analysis for professional technical analysis on the monitor of a computer.

Abstract finance background. Stock market graph on led screen. Finance and investment concept.
Stock PhotoUsername
MaximusndResolution
8858x4724pxAbstract finance background. Stock market graph on led screen. Finance and investment concept.

The business plan at the meeting and analyze financial numbers to view the performance of the company.
Stock PhotoUsername
MaximusndResolution
8858x4724pxThe business plan at the meeting and analyze financial numbers to view the performance of the company.
The business plan at the meeting and analyze financial numbers to view the performance of the company.
Stock PhotoUsername
MaximusndResolution
8858x4724pxThe business plan at the meeting and analyze financial numbers to view the performance of the company.

Stock or business market analysis concept. Business financial or stock market background.
Stock PhotoUsername
MaximusndResolution
8858x4724pxStock or business market analysis concept. Business financial or stock market background.
Data on a monitor which including of Market Analyze. Bar graphs, Diagrams, financial figures.
Stock PhotoUsername
MaximusndResolution
8858x4724pxData on a monitor which including of Market Analyze. Bar graphs, Diagrams, financial figures.

The business plan at the meeting and analyze financial numbers to view the performance of the company.
Stock PhotoUsername
MaximusndResolution
8858x4724pxThe business plan at the meeting and analyze financial numbers to view the performance of the company.
Abstract financial graph with candle stick and bar chart of stock market on financialbackground
Stock PhotoUsername
MaximusndResolution
8858x4724pxAbstract financial graph with candle stick and bar chart of stock market on financialbackground

Economic trends business idea and all art work design. Abstract finance background
Stock PhotoUsername
MaximusndResolution
8858x4724pxEconomic trends business idea and all art work design. Abstract finance background

Economic trends business idea and all art work design. Abstract finance background
Stock PhotoUsername
MaximusndResolution
8858x4724pxEconomic trends business idea and all art work design. Abstract finance background

Economic trends business idea and all art work design. Abstract finance background
Stock PhotoUsername
MaximusndResolution
8858x4724pxEconomic trends business idea and all art work design. Abstract finance background

Abstract financial graph with candle stick and bar chart of stock market on financialbackground
Stock PhotoUsername
MaximusndResolution
8858x4724pxAbstract financial graph with candle stick and bar chart of stock market on financialbackground
Charts of financial instruments with various type of indicators including volume analysis for professional technical analysis on the monitor of a computer.
Stock PhotoUsername
MaximusndResolution
5472x3648pxCharts of financial instruments with various type of indicators including volume analysis for professional technical analysis on the monitor of a computer.

Abstract financial graph with candle stick and bar chart of stock market on financialbackground
Stock PhotoUsername
MaximusndResolution
8858x4724pxAbstract financial graph with candle stick and bar chart of stock market on financialbackground
Financial diagram with candlestick chart used in market analysis for variation report of share price
Stock PhotoUsername
MaximusndResolution
8858x4724pxFinancial diagram with candlestick chart used in market analysis for variation report of share price